Japanese vs Immigrants from Switzerland 2nd Grade
COMPARE
Japanese
Immigrants from Switzerland
2nd Grade
2nd Grade Comparison
Japanese
Immigrants from Switzerland
96.5%
2ND GRADE
0.0/ 100
METRIC RATING
329th/ 347
METRIC RANK
98.1%
2ND GRADE
97.3/ 100
METRIC RATING
108th/ 347
METRIC RANK
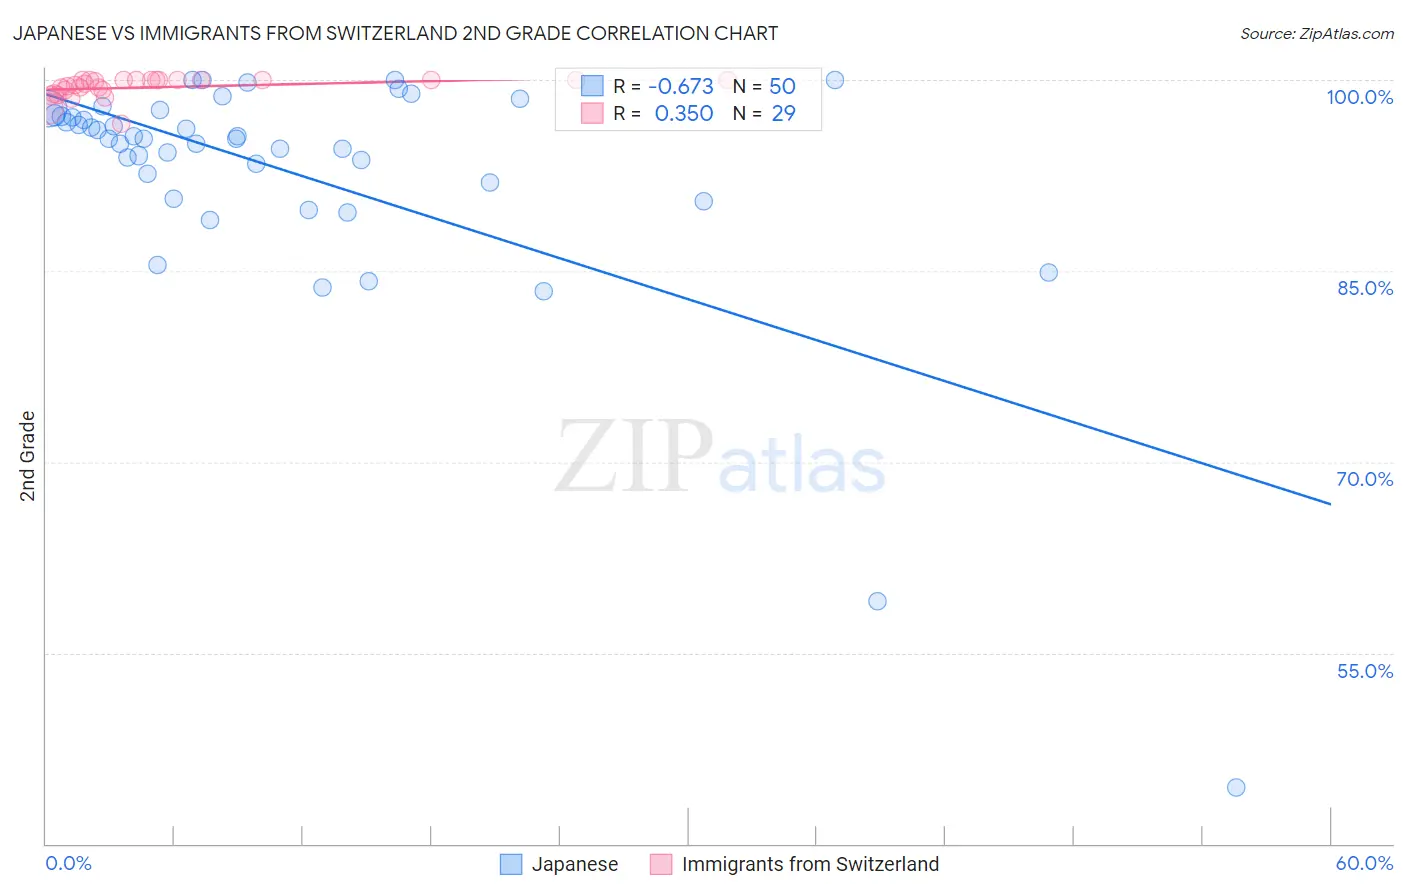
Japanese vs Immigrants from Switzerland 2nd Grade Correlation Chart
The statistical analysis conducted on geographies consisting of 249,183,224 people shows a significant negative correlation between the proportion of Japanese and percentage of population with at least 2nd grade education in the United States with a correlation coefficient (R) of -0.673 and weighted average of 96.5%. Similarly, the statistical analysis conducted on geographies consisting of 148,082,451 people shows a mild positive correlation between the proportion of Immigrants from Switzerland and percentage of population with at least 2nd grade education in the United States with a correlation coefficient (R) of 0.350 and weighted average of 98.1%, a difference of 1.7%.
2nd Grade Correlation Summary
| Measurement | Japanese | Immigrants from Switzerland |
| Minimum | 44.4% | 96.5% |
| Maximum | 100.0% | 100.0% |
| Range | 55.6% | 3.5% |
| Mean | 92.8% | 99.4% |
| Median | 95.4% | 99.7% |
| Interquartile 25% (IQ1) | 92.0% | 99.1% |
| Interquartile 75% (IQ3) | 97.2% | 100.0% |
| Interquartile Range (IQR) | 5.2% | 0.93% |
| Standard Deviation (Sample) | 9.7% | 0.80% |
| Standard Deviation (Population) | 9.6% | 0.79% |
Similar Demographics by 2nd Grade
Demographics Similar to Japanese by 2nd Grade
In terms of 2nd grade, the demographic groups most similar to Japanese are Mexican (96.5%, a difference of 0.0%), Immigrants from Vietnam (96.5%, a difference of 0.010%), Immigrants from Latin America (96.5%, a difference of 0.010%), Immigrants from Armenia (96.5%, a difference of 0.040%), and Bangladeshi (96.5%, a difference of 0.060%).
| Demographics | Rating | Rank | 2nd Grade |
| Immigrants | Bangladesh | 0.0 /100 | #322 | Tragic 96.7% |
| Vietnamese | 0.0 /100 | #323 | Tragic 96.7% |
| Mexican American Indians | 0.0 /100 | #324 | Tragic 96.7% |
| Dominicans | 0.0 /100 | #325 | Tragic 96.6% |
| Immigrants | Honduras | 0.0 /100 | #326 | Tragic 96.6% |
| Immigrants | Vietnam | 0.0 /100 | #327 | Tragic 96.5% |
| Mexicans | 0.0 /100 | #328 | Tragic 96.5% |
| Japanese | 0.0 /100 | #329 | Tragic 96.5% |
| Immigrants | Latin America | 0.0 /100 | #330 | Tragic 96.5% |
| Immigrants | Armenia | 0.0 /100 | #331 | Tragic 96.5% |
| Bangladeshis | 0.0 /100 | #332 | Tragic 96.5% |
| Immigrants | Dominican Republic | 0.0 /100 | #333 | Tragic 96.4% |
| Central Americans | 0.0 /100 | #334 | Tragic 96.4% |
| Yakama | 0.0 /100 | #335 | Tragic 96.4% |
| Immigrants | Fiji | 0.0 /100 | #336 | Tragic 96.4% |
Demographics Similar to Immigrants from Switzerland by 2nd Grade
In terms of 2nd grade, the demographic groups most similar to Immigrants from Switzerland are Bhutanese (98.1%, a difference of 0.0%), German Russian (98.1%, a difference of 0.0%), Basque (98.1%, a difference of 0.0%), Pima (98.2%, a difference of 0.010%), and Turkish (98.2%, a difference of 0.010%).
| Demographics | Rating | Rank | 2nd Grade |
| Puget Sound Salish | 98.0 /100 | #101 | Exceptional 98.2% |
| Cree | 98.0 /100 | #102 | Exceptional 98.2% |
| Pima | 97.6 /100 | #103 | Exceptional 98.2% |
| Turks | 97.6 /100 | #104 | Exceptional 98.2% |
| Yugoslavians | 97.5 /100 | #105 | Exceptional 98.2% |
| Bhutanese | 97.5 /100 | #106 | Exceptional 98.1% |
| German Russians | 97.4 /100 | #107 | Exceptional 98.1% |
| Immigrants | Switzerland | 97.3 /100 | #108 | Exceptional 98.1% |
| Basques | 97.2 /100 | #109 | Exceptional 98.1% |
| Immigrants | Singapore | 97.0 /100 | #110 | Exceptional 98.1% |
| Immigrants | Czechoslovakia | 96.9 /100 | #111 | Exceptional 98.1% |
| Colville | 96.6 /100 | #112 | Exceptional 98.1% |
| Immigrants | Norway | 96.5 /100 | #113 | Exceptional 98.1% |
| Immigrants | Latvia | 96.4 /100 | #114 | Exceptional 98.1% |
| Iranians | 95.9 /100 | #115 | Exceptional 98.1% |