Immigrants from Cuba vs Immigrants from Belarus Nursery School
COMPARE
Immigrants from Cuba
Immigrants from Belarus
Nursery School
Nursery School Comparison
Immigrants from Cuba
Immigrants from Belarus
97.2%
NURSERY SCHOOL
0.0/ 100
METRIC RATING
297th/ 347
METRIC RANK
98.0%
NURSERY SCHOOL
41.0/ 100
METRIC RATING
185th/ 347
METRIC RANK
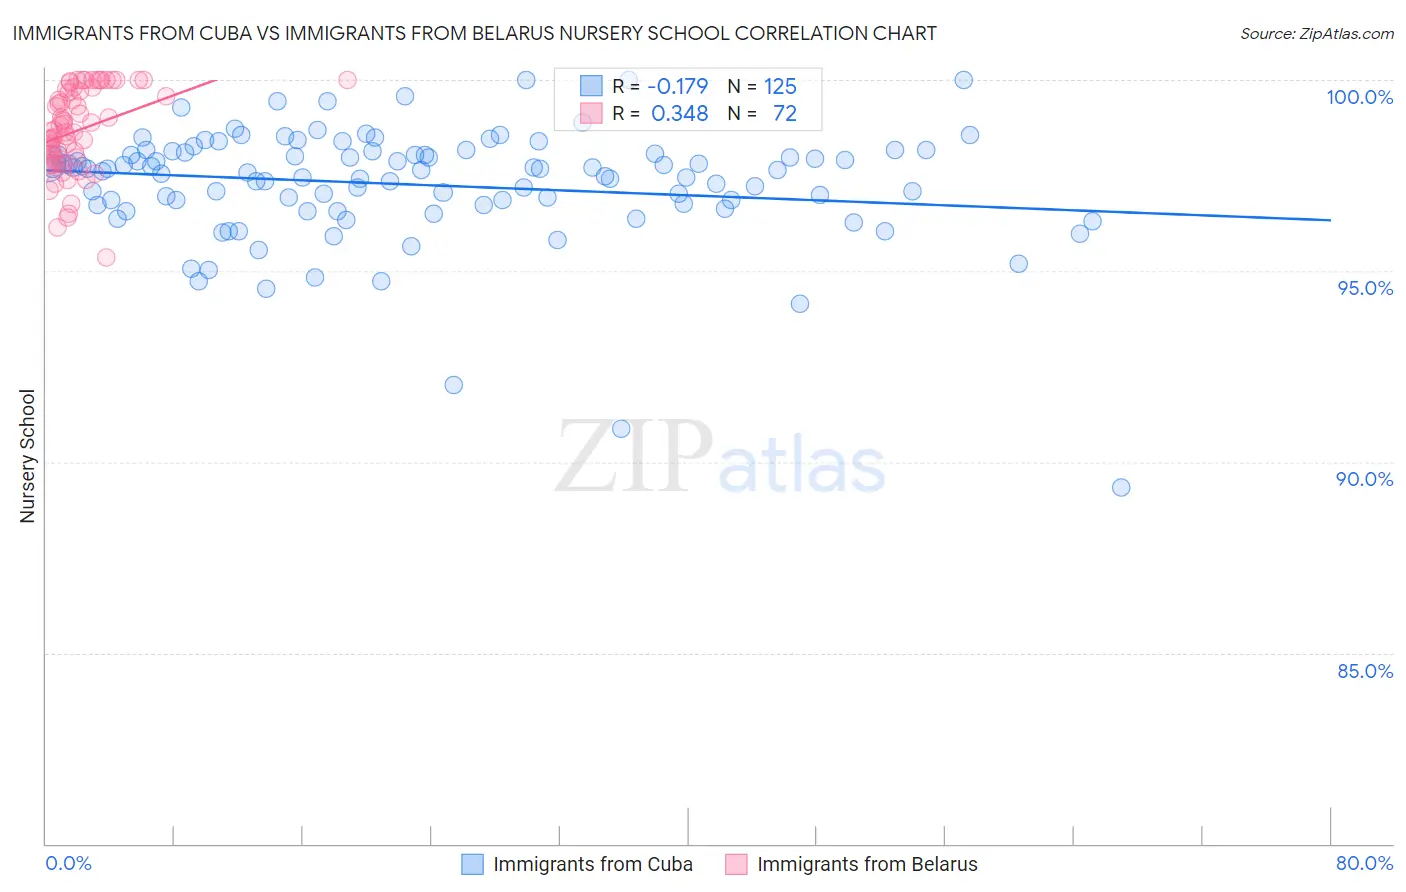
Immigrants from Cuba vs Immigrants from Belarus Nursery School Correlation Chart
The statistical analysis conducted on geographies consisting of 326,028,159 people shows a poor negative correlation between the proportion of Immigrants from Cuba and percentage of population with at least nursery school education in the United States with a correlation coefficient (R) of -0.179 and weighted average of 97.2%. Similarly, the statistical analysis conducted on geographies consisting of 149,993,317 people shows a mild positive correlation between the proportion of Immigrants from Belarus and percentage of population with at least nursery school education in the United States with a correlation coefficient (R) of 0.348 and weighted average of 98.0%, a difference of 0.78%.
Nursery School Correlation Summary
| Measurement | Immigrants from Cuba | Immigrants from Belarus |
| Minimum | 89.3% | 95.4% |
| Maximum | 100.0% | 100.0% |
| Range | 10.7% | 4.6% |
| Mean | 97.3% | 98.7% |
| Median | 97.6% | 98.7% |
| Interquartile 25% (IQ1) | 96.7% | 97.9% |
| Interquartile 75% (IQ3) | 98.1% | 99.7% |
| Interquartile Range (IQR) | 1.4% | 1.8% |
| Standard Deviation (Sample) | 1.5% | 1.1% |
| Standard Deviation (Population) | 1.5% | 1.1% |
Similar Demographics by Nursery School
Demographics Similar to Immigrants from Cuba by Nursery School
In terms of nursery school, the demographic groups most similar to Immigrants from Cuba are Central American Indian (97.2%, a difference of 0.010%), Immigrants from Dominica (97.2%, a difference of 0.010%), Haitian (97.2%, a difference of 0.030%), Immigrants from Eritrea (97.2%, a difference of 0.040%), and Immigrants (97.2%, a difference of 0.050%).
| Demographics | Rating | Rank | Nursery School |
| Immigrants | Afghanistan | 0.0 /100 | #290 | Tragic 97.3% |
| British West Indians | 0.0 /100 | #291 | Tragic 97.3% |
| Houma | 0.0 /100 | #292 | Tragic 97.3% |
| Malaysians | 0.0 /100 | #293 | Tragic 97.3% |
| Immigrants | Grenada | 0.0 /100 | #294 | Tragic 97.3% |
| Immigrants | Immigrants | 0.0 /100 | #295 | Tragic 97.2% |
| Immigrants | Eritrea | 0.0 /100 | #296 | Tragic 97.2% |
| Immigrants | Cuba | 0.0 /100 | #297 | Tragic 97.2% |
| Central American Indians | 0.0 /100 | #298 | Tragic 97.2% |
| Immigrants | Dominica | 0.0 /100 | #299 | Tragic 97.2% |
| Haitians | 0.0 /100 | #300 | Tragic 97.2% |
| Immigrants | South Eastern Asia | 0.0 /100 | #301 | Tragic 97.1% |
| Immigrants | Caribbean | 0.0 /100 | #302 | Tragic 97.1% |
| Nicaraguans | 0.0 /100 | #303 | Tragic 97.1% |
| Ecuadorians | 0.0 /100 | #304 | Tragic 97.1% |
Demographics Similar to Immigrants from Belarus by Nursery School
In terms of nursery school, the demographic groups most similar to Immigrants from Belarus are Paiute (98.0%, a difference of 0.0%), Portuguese (98.0%, a difference of 0.0%), Immigrants from Poland (98.0%, a difference of 0.0%), Immigrants from Argentina (98.0%, a difference of 0.0%), and Immigrants from Bosnia and Herzegovina (98.0%, a difference of 0.010%).
| Demographics | Rating | Rank | Nursery School |
| Natives/Alaskans | 48.6 /100 | #178 | Average 98.0% |
| Argentineans | 46.8 /100 | #179 | Average 98.0% |
| Immigrants | Bosnia and Herzegovina | 45.6 /100 | #180 | Average 98.0% |
| Egyptians | 42.8 /100 | #181 | Average 98.0% |
| Paiute | 42.0 /100 | #182 | Average 98.0% |
| Portuguese | 41.8 /100 | #183 | Average 98.0% |
| Immigrants | Poland | 41.3 /100 | #184 | Average 98.0% |
| Immigrants | Belarus | 41.0 /100 | #185 | Average 98.0% |
| Immigrants | Argentina | 40.8 /100 | #186 | Average 98.0% |
| Immigrants | Kazakhstan | 37.1 /100 | #187 | Fair 97.9% |
| Arabs | 34.7 /100 | #188 | Fair 97.9% |
| Pakistanis | 34.6 /100 | #189 | Fair 97.9% |
| Panamanians | 34.3 /100 | #190 | Fair 97.9% |
| Immigrants | Taiwan | 30.6 /100 | #191 | Fair 97.9% |
| Blacks/African Americans | 29.4 /100 | #192 | Fair 97.9% |