Lithuanian vs Potawatomi 10th Grade
COMPARE
Lithuanian
Potawatomi
10th Grade
10th Grade Comparison
Lithuanians
Potawatomi
95.8%
10TH GRADE
100.0/ 100
METRIC RATING
8th/ 347
METRIC RANK
94.3%
10TH GRADE
93.6/ 100
METRIC RATING
128th/ 347
METRIC RANK
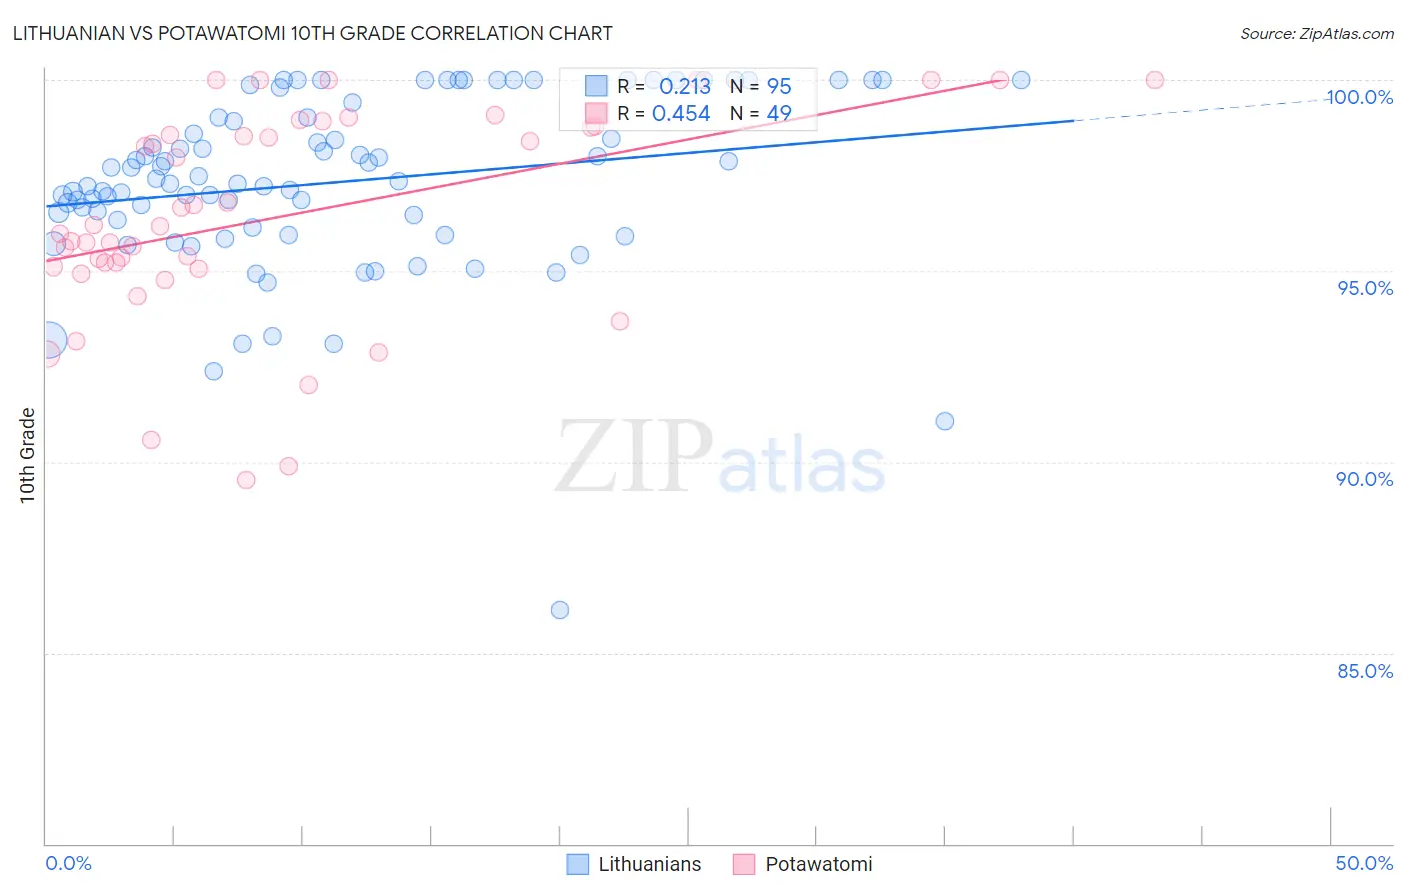
Lithuanian vs Potawatomi 10th Grade Correlation Chart
The statistical analysis conducted on geographies consisting of 421,947,524 people shows a weak positive correlation between the proportion of Lithuanians and percentage of population with at least 10th grade education in the United States with a correlation coefficient (R) of 0.213 and weighted average of 95.8%. Similarly, the statistical analysis conducted on geographies consisting of 117,769,158 people shows a moderate positive correlation between the proportion of Potawatomi and percentage of population with at least 10th grade education in the United States with a correlation coefficient (R) of 0.454 and weighted average of 94.3%, a difference of 1.6%.
10th Grade Correlation Summary
| Measurement | Lithuanian | Potawatomi |
| Minimum | 86.1% | 89.5% |
| Maximum | 100.0% | 100.0% |
| Range | 13.9% | 10.5% |
| Mean | 97.3% | 96.4% |
| Median | 97.4% | 96.2% |
| Interquartile 25% (IQ1) | 96.1% | 95.1% |
| Interquartile 75% (IQ3) | 99.0% | 98.8% |
| Interquartile Range (IQR) | 2.9% | 3.7% |
| Standard Deviation (Sample) | 2.3% | 2.8% |
| Standard Deviation (Population) | 2.3% | 2.7% |
Similar Demographics by 10th Grade
Demographics Similar to Lithuanians by 10th Grade
In terms of 10th grade, the demographic groups most similar to Lithuanians are German (95.8%, a difference of 0.010%), Polish (95.8%, a difference of 0.030%), Finnish (95.8%, a difference of 0.060%), Croatian (95.7%, a difference of 0.080%), and Danish (95.7%, a difference of 0.11%).
| Demographics | Rating | Rank | 10th Grade |
| Norwegians | 100.0 /100 | #1 | Exceptional 96.2% |
| Slovaks | 100.0 /100 | #2 | Exceptional 96.0% |
| Slovenes | 100.0 /100 | #3 | Exceptional 95.9% |
| Swedes | 100.0 /100 | #4 | Exceptional 95.9% |
| Carpatho Rusyns | 100.0 /100 | #5 | Exceptional 95.9% |
| Poles | 100.0 /100 | #6 | Exceptional 95.8% |
| Germans | 100.0 /100 | #7 | Exceptional 95.8% |
| Lithuanians | 100.0 /100 | #8 | Exceptional 95.8% |
| Finns | 100.0 /100 | #9 | Exceptional 95.8% |
| Croatians | 100.0 /100 | #10 | Exceptional 95.7% |
| Danes | 100.0 /100 | #11 | Exceptional 95.7% |
| Tlingit-Haida | 100.0 /100 | #12 | Exceptional 95.7% |
| English | 100.0 /100 | #13 | Exceptional 95.6% |
| Tsimshian | 100.0 /100 | #14 | Exceptional 95.6% |
| Irish | 100.0 /100 | #15 | Exceptional 95.6% |
Demographics Similar to Potawatomi by 10th Grade
In terms of 10th grade, the demographic groups most similar to Potawatomi are Israeli (94.3%, a difference of 0.010%), American (94.3%, a difference of 0.030%), Immigrants from Iran (94.3%, a difference of 0.030%), Iroquois (94.3%, a difference of 0.030%), and Immigrants from Greece (94.3%, a difference of 0.030%).
| Demographics | Rating | Rank | 10th Grade |
| Immigrants | Belarus | 95.2 /100 | #121 | Exceptional 94.4% |
| Inupiat | 95.1 /100 | #122 | Exceptional 94.4% |
| Cree | 95.1 /100 | #123 | Exceptional 94.4% |
| Basques | 94.9 /100 | #124 | Exceptional 94.3% |
| Americans | 94.4 /100 | #125 | Exceptional 94.3% |
| Immigrants | Iran | 94.4 /100 | #126 | Exceptional 94.3% |
| Israelis | 93.8 /100 | #127 | Exceptional 94.3% |
| Potawatomi | 93.6 /100 | #128 | Exceptional 94.3% |
| Iroquois | 92.8 /100 | #129 | Exceptional 94.3% |
| Immigrants | Greece | 92.7 /100 | #130 | Exceptional 94.3% |
| Immigrants | Eastern Europe | 92.5 /100 | #131 | Exceptional 94.3% |
| Immigrants | Russia | 92.4 /100 | #132 | Exceptional 94.3% |
| Creek | 91.9 /100 | #133 | Exceptional 94.2% |
| Osage | 91.7 /100 | #134 | Exceptional 94.2% |
| Immigrants | Korea | 91.3 /100 | #135 | Exceptional 94.2% |