Syrian vs Immigrants from Indonesia 6th Grade
COMPARE
Syrian
Immigrants from Indonesia
6th Grade
6th Grade Comparison
Syrians
Immigrants from Indonesia
97.4%
6TH GRADE
94.8/ 100
METRIC RATING
120th/ 347
METRIC RANK
96.6%
6TH GRADE
2.3/ 100
METRIC RATING
236th/ 347
METRIC RANK
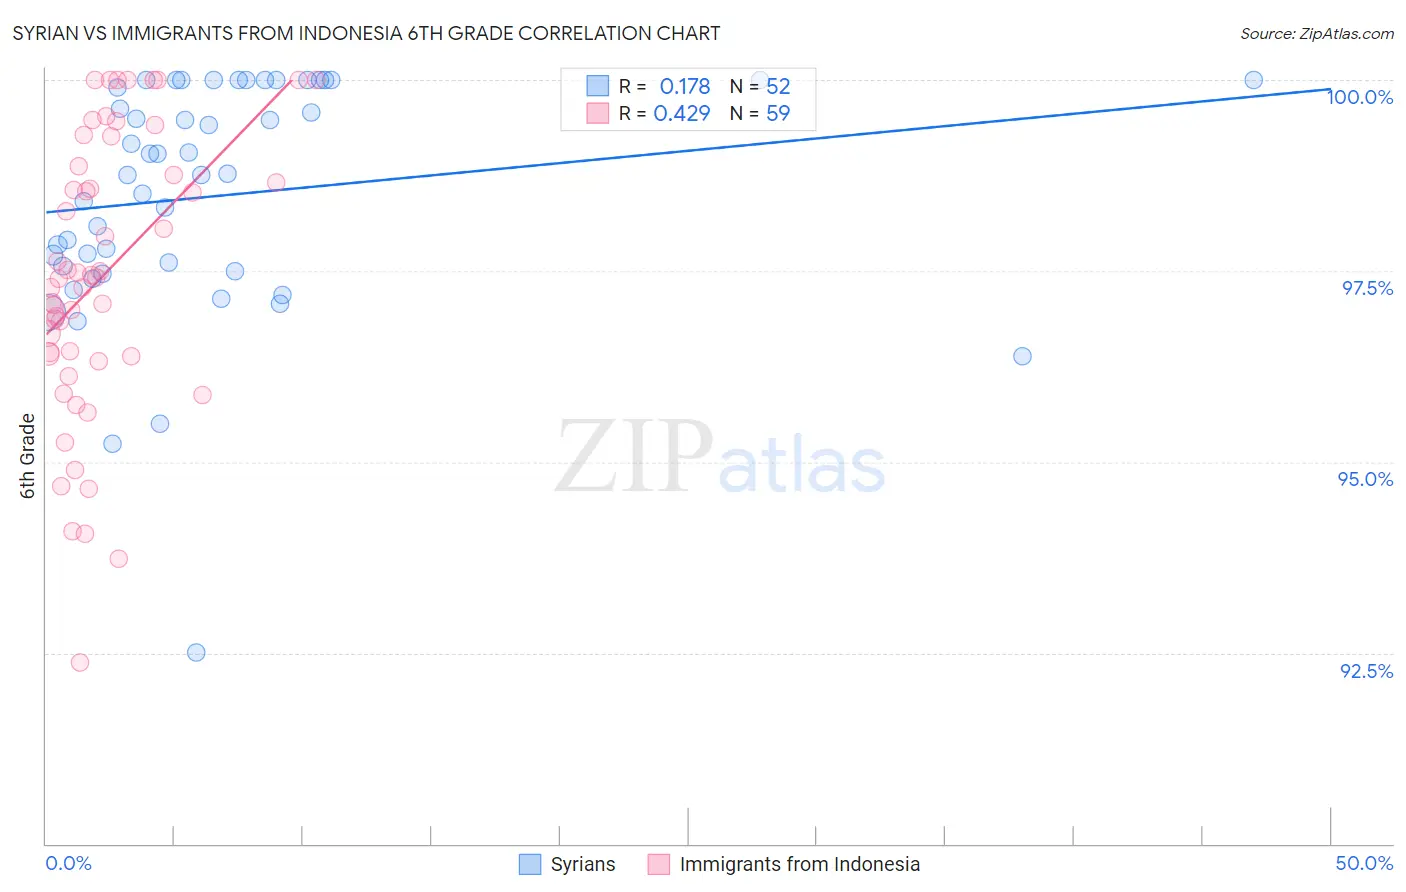
Syrian vs Immigrants from Indonesia 6th Grade Correlation Chart
The statistical analysis conducted on geographies consisting of 266,305,988 people shows a poor positive correlation between the proportion of Syrians and percentage of population with at least 6th grade education in the United States with a correlation coefficient (R) of 0.178 and weighted average of 97.4%. Similarly, the statistical analysis conducted on geographies consisting of 215,782,971 people shows a moderate positive correlation between the proportion of Immigrants from Indonesia and percentage of population with at least 6th grade education in the United States with a correlation coefficient (R) of 0.429 and weighted average of 96.6%, a difference of 0.76%.
6th Grade Correlation Summary
| Measurement | Syrian | Immigrants from Indonesia |
| Minimum | 92.5% | 92.4% |
| Maximum | 100.0% | 100.0% |
| Range | 7.5% | 7.6% |
| Mean | 98.5% | 97.4% |
| Median | 98.8% | 97.4% |
| Interquartile 25% (IQ1) | 97.5% | 96.4% |
| Interquartile 75% (IQ3) | 100.0% | 98.9% |
| Interquartile Range (IQR) | 2.5% | 2.5% |
| Standard Deviation (Sample) | 1.5% | 1.8% |
| Standard Deviation (Population) | 1.5% | 1.8% |
Similar Demographics by 6th Grade
Demographics Similar to Syrians by 6th Grade
In terms of 6th grade, the demographic groups most similar to Syrians are Immigrants from Zimbabwe (97.4%, a difference of 0.0%), Immigrants from Norway (97.4%, a difference of 0.0%), Basque (97.4%, a difference of 0.010%), Immigrants from Japan (97.4%, a difference of 0.010%), and Immigrants from France (97.4%, a difference of 0.010%).
| Demographics | Rating | Rank | 6th Grade |
| Immigrants | Saudi Arabia | 96.5 /100 | #113 | Exceptional 97.4% |
| Colville | 96.4 /100 | #114 | Exceptional 97.4% |
| Immigrants | Switzerland | 95.7 /100 | #115 | Exceptional 97.4% |
| Lebanese | 95.5 /100 | #116 | Exceptional 97.4% |
| Basques | 95.4 /100 | #117 | Exceptional 97.4% |
| Immigrants | Japan | 95.2 /100 | #118 | Exceptional 97.4% |
| Immigrants | Zimbabwe | 95.0 /100 | #119 | Exceptional 97.4% |
| Syrians | 94.8 /100 | #120 | Exceptional 97.4% |
| Immigrants | Norway | 94.7 /100 | #121 | Exceptional 97.4% |
| Immigrants | France | 94.5 /100 | #122 | Exceptional 97.4% |
| Hmong | 94.4 /100 | #123 | Exceptional 97.4% |
| Okinawans | 94.2 /100 | #124 | Exceptional 97.4% |
| Spanish | 93.7 /100 | #125 | Exceptional 97.3% |
| Immigrants | Bulgaria | 93.6 /100 | #126 | Exceptional 97.3% |
| Immigrants | Croatia | 93.1 /100 | #127 | Exceptional 97.3% |
Demographics Similar to Immigrants from Indonesia by 6th Grade
In terms of 6th grade, the demographic groups most similar to Immigrants from Indonesia are Uruguayan (96.6%, a difference of 0.010%), Asian (96.6%, a difference of 0.010%), Immigrants from Eastern Africa (96.6%, a difference of 0.010%), Nigerian (96.6%, a difference of 0.020%), and Indian (Asian) (96.6%, a difference of 0.020%).
| Demographics | Rating | Rank | 6th Grade |
| Assyrians/Chaldeans/Syriacs | 4.0 /100 | #229 | Tragic 96.7% |
| Immigrants | Eastern Asia | 4.0 /100 | #230 | Tragic 96.7% |
| Sub-Saharan Africans | 3.5 /100 | #231 | Tragic 96.7% |
| South American Indians | 3.5 /100 | #232 | Tragic 96.7% |
| Yuman | 3.2 /100 | #233 | Tragic 96.7% |
| Uruguayans | 2.5 /100 | #234 | Tragic 96.6% |
| Asians | 2.4 /100 | #235 | Tragic 96.6% |
| Immigrants | Indonesia | 2.3 /100 | #236 | Tragic 96.6% |
| Immigrants | Eastern Africa | 2.0 /100 | #237 | Tragic 96.6% |
| Nigerians | 1.9 /100 | #238 | Tragic 96.6% |
| Indians (Asian) | 1.9 /100 | #239 | Tragic 96.6% |
| Koreans | 1.9 /100 | #240 | Tragic 96.6% |
| Senegalese | 1.8 /100 | #241 | Tragic 96.6% |
| Immigrants | Asia | 1.8 /100 | #242 | Tragic 96.6% |
| Immigrants | Liberia | 1.6 /100 | #243 | Tragic 96.6% |