Ecuadorian vs Immigrants from China Professional Degree
COMPARE
Ecuadorian
Immigrants from China
Professional Degree
Professional Degree Comparison
Ecuadorians
Immigrants from China
3.9%
PROFESSIONAL DEGREE
4.6/ 100
METRIC RATING
231st/ 347
METRIC RANK
6.7%
PROFESSIONAL DEGREE
100.0/ 100
METRIC RATING
15th/ 347
METRIC RANK
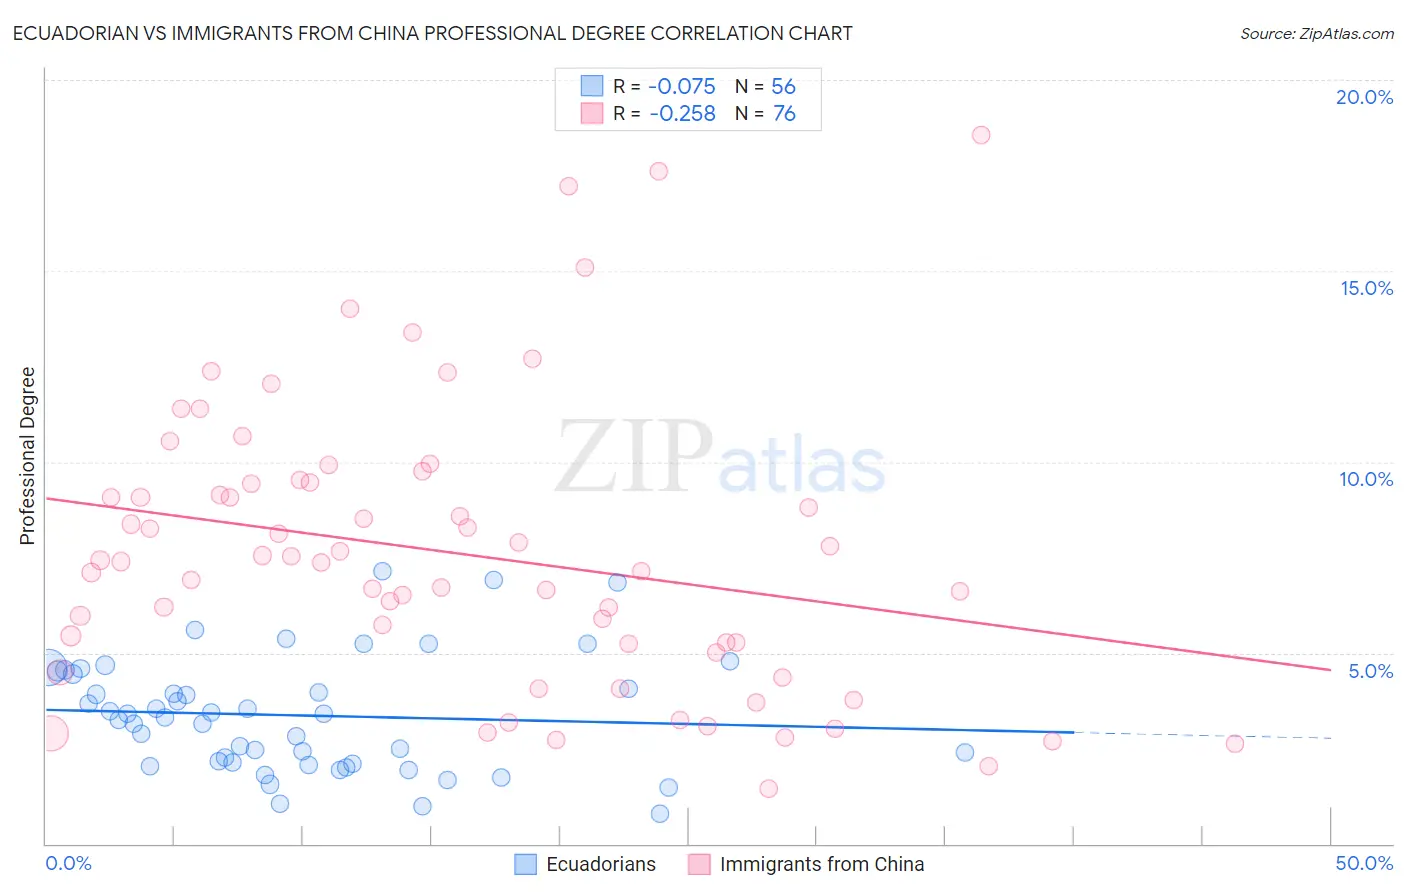
Ecuadorian vs Immigrants from China Professional Degree Correlation Chart
The statistical analysis conducted on geographies consisting of 317,407,214 people shows a slight negative correlation between the proportion of Ecuadorians and percentage of population with at least professional degree education in the United States with a correlation coefficient (R) of -0.075 and weighted average of 3.9%. Similarly, the statistical analysis conducted on geographies consisting of 455,966,204 people shows a weak negative correlation between the proportion of Immigrants from China and percentage of population with at least professional degree education in the United States with a correlation coefficient (R) of -0.258 and weighted average of 6.7%, a difference of 71.7%.
Professional Degree Correlation Summary
| Measurement | Ecuadorian | Immigrants from China |
| Minimum | 0.77% | 1.4% |
| Maximum | 7.1% | 18.6% |
| Range | 6.4% | 17.1% |
| Mean | 3.4% | 7.6% |
| Median | 3.4% | 7.4% |
| Interquartile 25% (IQ1) | 2.1% | 5.1% |
| Interquartile 75% (IQ3) | 4.5% | 9.5% |
| Interquartile Range (IQR) | 2.4% | 4.3% |
| Standard Deviation (Sample) | 1.5% | 3.7% |
| Standard Deviation (Population) | 1.5% | 3.7% |
Similar Demographics by Professional Degree
Demographics Similar to Ecuadorians by Professional Degree
In terms of professional degree, the demographic groups most similar to Ecuadorians are Cree (3.9%, a difference of 0.21%), Nicaraguan (3.9%, a difference of 0.46%), Immigrants from Philippines (3.9%, a difference of 0.47%), Nonimmigrants (3.9%, a difference of 0.52%), and Immigrants from Barbados (3.9%, a difference of 0.53%).
| Demographics | Rating | Rank | Professional Degree |
| Trinidadians and Tobagonians | 7.1 /100 | #224 | Tragic 4.0% |
| Tlingit-Haida | 6.9 /100 | #225 | Tragic 4.0% |
| German Russians | 6.1 /100 | #226 | Tragic 4.0% |
| Cubans | 5.9 /100 | #227 | Tragic 4.0% |
| Immigrants | West Indies | 5.6 /100 | #228 | Tragic 4.0% |
| Immigrants | Burma/Myanmar | 5.4 /100 | #229 | Tragic 3.9% |
| Nicaraguans | 5.1 /100 | #230 | Tragic 3.9% |
| Ecuadorians | 4.6 /100 | #231 | Tragic 3.9% |
| Cree | 4.3 /100 | #232 | Tragic 3.9% |
| Immigrants | Philippines | 4.1 /100 | #233 | Tragic 3.9% |
| Immigrants | Nonimmigrants | 4.0 /100 | #234 | Tragic 3.9% |
| Immigrants | Barbados | 4.0 /100 | #235 | Tragic 3.9% |
| Spanish Americans | 3.8 /100 | #236 | Tragic 3.9% |
| Immigrants | Trinidad and Tobago | 3.8 /100 | #237 | Tragic 3.9% |
| Colville | 2.6 /100 | #238 | Tragic 3.8% |
Demographics Similar to Immigrants from China by Professional Degree
In terms of professional degree, the demographic groups most similar to Immigrants from China are Immigrants from Sweden (6.7%, a difference of 0.45%), Immigrants from France (6.8%, a difference of 1.1%), Immigrants from Eastern Asia (6.6%, a difference of 2.5%), Soviet Union (6.6%, a difference of 2.5%), and Immigrants from Australia (6.9%, a difference of 2.6%).
| Demographics | Rating | Rank | Professional Degree |
| Immigrants | Switzerland | 100.0 /100 | #8 | Exceptional 7.1% |
| Immigrants | Taiwan | 100.0 /100 | #9 | Exceptional 7.1% |
| Immigrants | Belgium | 100.0 /100 | #10 | Exceptional 7.0% |
| Cypriots | 100.0 /100 | #11 | Exceptional 6.9% |
| Israelis | 100.0 /100 | #12 | Exceptional 6.9% |
| Immigrants | Australia | 100.0 /100 | #13 | Exceptional 6.9% |
| Immigrants | France | 100.0 /100 | #14 | Exceptional 6.8% |
| Immigrants | China | 100.0 /100 | #15 | Exceptional 6.7% |
| Immigrants | Sweden | 100.0 /100 | #16 | Exceptional 6.7% |
| Immigrants | Eastern Asia | 100.0 /100 | #17 | Exceptional 6.6% |
| Soviet Union | 100.0 /100 | #18 | Exceptional 6.6% |
| Indians (Asian) | 100.0 /100 | #19 | Exceptional 6.5% |
| Immigrants | Denmark | 100.0 /100 | #20 | Exceptional 6.4% |
| Immigrants | Hong Kong | 100.0 /100 | #21 | Exceptional 6.4% |
| Immigrants | Japan | 100.0 /100 | #22 | Exceptional 6.4% |