Jamaican vs Cuban Unemployment Among Ages 25 to 29 years
COMPARE
Jamaican
Cuban
Unemployment Among Ages 25 to 29 years
Unemployment Among Ages 25 to 29 years Comparison
Jamaicans
Cubans
7.9%
UNEMPLOYMENT AMONG AGES 25 TO 29 YEARS
0.0/ 100
METRIC RATING
302nd/ 347
METRIC RANK
5.9%
UNEMPLOYMENT AMONG AGES 25 TO 29 YEARS
99.9/ 100
METRIC RATING
15th/ 347
METRIC RANK
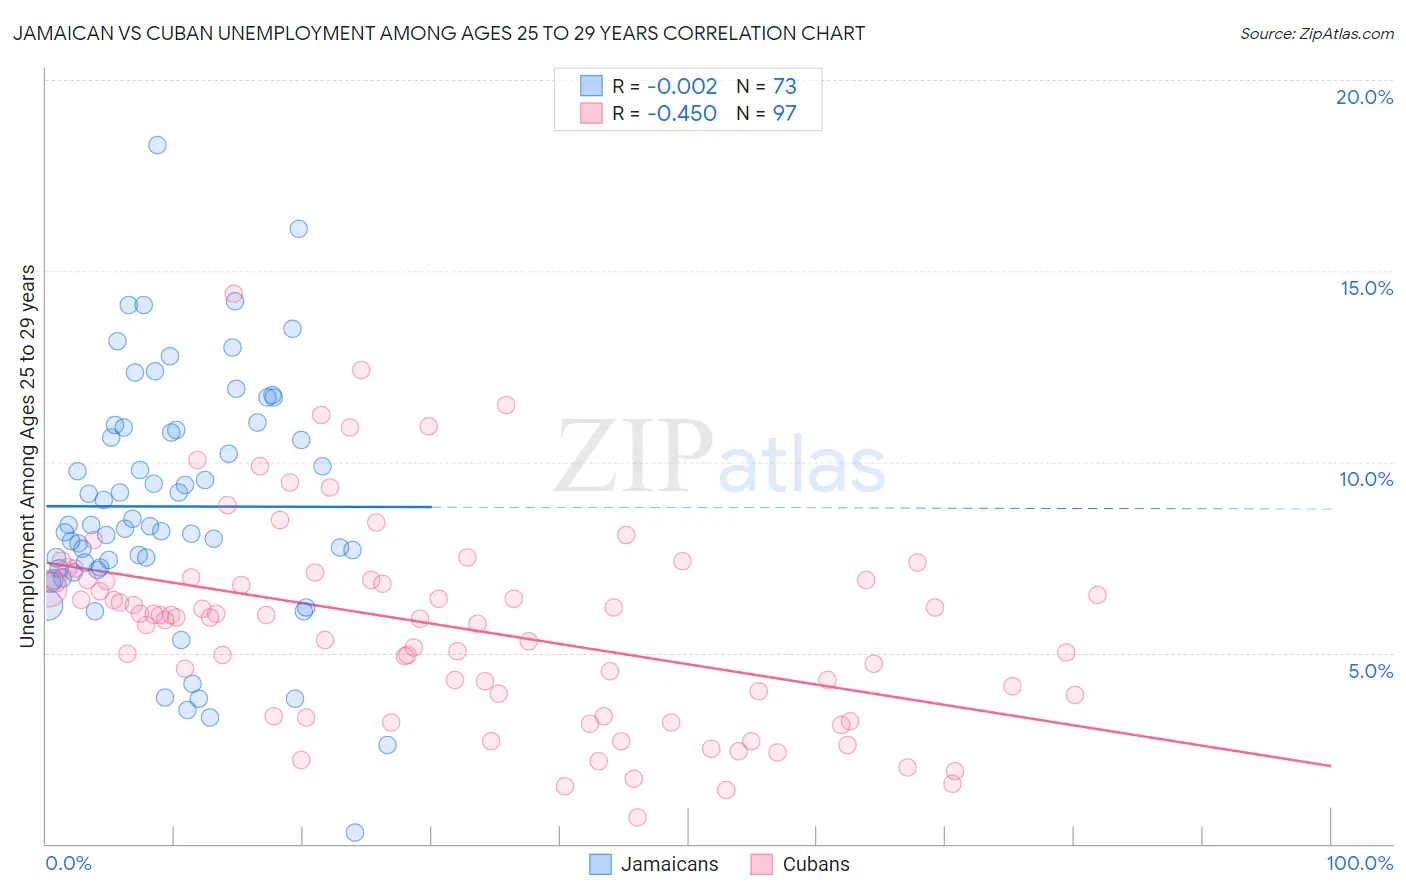
Jamaican vs Cuban Unemployment Among Ages 25 to 29 years Correlation Chart
The statistical analysis conducted on geographies consisting of 352,650,790 people shows no correlation between the proportion of Jamaicans and unemployment rate among population between the ages 25 and 29 in the United States with a correlation coefficient (R) of -0.002 and weighted average of 7.9%. Similarly, the statistical analysis conducted on geographies consisting of 424,519,205 people shows a moderate negative correlation between the proportion of Cubans and unemployment rate among population between the ages 25 and 29 in the United States with a correlation coefficient (R) of -0.450 and weighted average of 5.9%, a difference of 33.9%.
Unemployment Among Ages 25 to 29 years Correlation Summary
| Measurement | Jamaican | Cuban |
| Minimum | 0.30% | 0.70% |
| Maximum | 18.3% | 14.4% |
| Range | 18.0% | 13.7% |
| Mean | 8.8% | 5.7% |
| Median | 8.3% | 5.9% |
| Interquartile 25% (IQ1) | 7.2% | 3.6% |
| Interquartile 75% (IQ3) | 10.9% | 6.9% |
| Interquartile Range (IQR) | 3.7% | 3.3% |
| Standard Deviation (Sample) | 3.2% | 2.6% |
| Standard Deviation (Population) | 3.2% | 2.6% |
Similar Demographics by Unemployment Among Ages 25 to 29 years
Demographics Similar to Jamaicans by Unemployment Among Ages 25 to 29 years
In terms of unemployment among ages 25 to 29 years, the demographic groups most similar to Jamaicans are West Indian (7.9%, a difference of 0.16%), Central American Indian (7.9%, a difference of 0.18%), Barbadian (7.9%, a difference of 0.20%), Immigrants from Trinidad and Tobago (7.9%, a difference of 0.38%), and Blackfeet (7.9%, a difference of 0.64%).
| Demographics | Rating | Rank | Unemployment Among Ages 25 to 29 years |
| Comanche | 0.0 /100 | #295 | Tragic 7.8% |
| Immigrants | West Indies | 0.0 /100 | #296 | Tragic 7.8% |
| Blackfeet | 0.0 /100 | #297 | Tragic 7.9% |
| Immigrants | Trinidad and Tobago | 0.0 /100 | #298 | Tragic 7.9% |
| Barbadians | 0.0 /100 | #299 | Tragic 7.9% |
| Central American Indians | 0.0 /100 | #300 | Tragic 7.9% |
| West Indians | 0.0 /100 | #301 | Tragic 7.9% |
| Jamaicans | 0.0 /100 | #302 | Tragic 7.9% |
| Immigrants | Yemen | 0.0 /100 | #303 | Tragic 8.0% |
| Cajuns | 0.0 /100 | #304 | Tragic 8.0% |
| Tsimshian | 0.0 /100 | #305 | Tragic 8.0% |
| Haitians | 0.0 /100 | #306 | Tragic 8.0% |
| Immigrants | Barbados | 0.0 /100 | #307 | Tragic 8.0% |
| Immigrants | Jamaica | 0.0 /100 | #308 | Tragic 8.1% |
| Immigrants | Haiti | 0.0 /100 | #309 | Tragic 8.1% |
Demographics Similar to Cubans by Unemployment Among Ages 25 to 29 years
In terms of unemployment among ages 25 to 29 years, the demographic groups most similar to Cubans are Immigrants from Bulgaria (5.9%, a difference of 0.010%), Bolivian (5.9%, a difference of 0.15%), Immigrants from Singapore (5.9%, a difference of 0.26%), Immigrants from Kuwait (5.9%, a difference of 0.35%), and Thai (5.9%, a difference of 0.41%).
| Demographics | Rating | Rank | Unemployment Among Ages 25 to 29 years |
| Immigrants | Bosnia and Herzegovina | 100.0 /100 | #8 | Exceptional 5.7% |
| Immigrants | Nepal | 100.0 /100 | #9 | Exceptional 5.7% |
| Immigrants | Sudan | 100.0 /100 | #10 | Exceptional 5.8% |
| Cambodians | 100.0 /100 | #11 | Exceptional 5.8% |
| Okinawans | 100.0 /100 | #12 | Exceptional 5.9% |
| Immigrants | Bolivia | 100.0 /100 | #13 | Exceptional 5.9% |
| Immigrants | Kuwait | 99.9 /100 | #14 | Exceptional 5.9% |
| Cubans | 99.9 /100 | #15 | Exceptional 5.9% |
| Immigrants | Bulgaria | 99.9 /100 | #16 | Exceptional 5.9% |
| Bolivians | 99.9 /100 | #17 | Exceptional 5.9% |
| Immigrants | Singapore | 99.9 /100 | #18 | Exceptional 5.9% |
| Thais | 99.9 /100 | #19 | Exceptional 5.9% |
| Immigrants | Eritrea | 99.9 /100 | #20 | Exceptional 5.9% |
| Immigrants | Ethiopia | 99.9 /100 | #21 | Exceptional 6.0% |
| Immigrants | Japan | 99.9 /100 | #22 | Exceptional 6.0% |