Italian vs Colombian No Schooling Completed
COMPARE
Italian
Colombian
No Schooling Completed
No Schooling Completed Comparison
Italians
Colombians
1.5%
NO SCHOOLING COMPLETED
100.0/ 100
METRIC RATING
33rd/ 347
METRIC RANK
2.3%
NO SCHOOLING COMPLETED
3.2/ 100
METRIC RATING
232nd/ 347
METRIC RANK
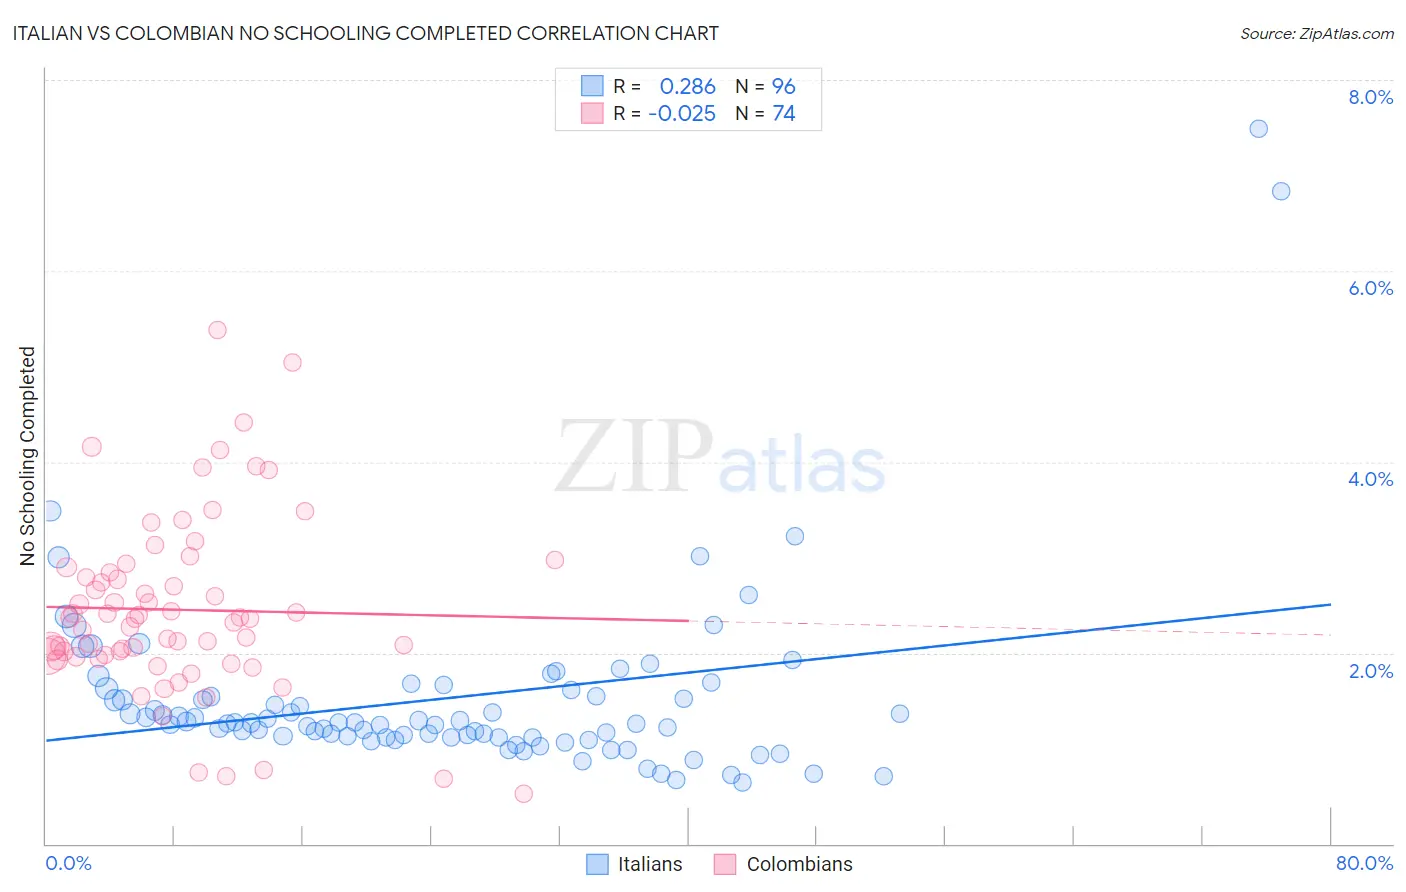
Italian vs Colombian No Schooling Completed Correlation Chart
The statistical analysis conducted on geographies consisting of 555,839,647 people shows a weak positive correlation between the proportion of Italians and percentage of population with no schooling in the United States with a correlation coefficient (R) of 0.286 and weighted average of 1.5%. Similarly, the statistical analysis conducted on geographies consisting of 415,449,893 people shows no correlation between the proportion of Colombians and percentage of population with no schooling in the United States with a correlation coefficient (R) of -0.025 and weighted average of 2.3%, a difference of 51.5%.
No Schooling Completed Correlation Summary
| Measurement | Italian | Colombian |
| Minimum | 0.64% | 0.52% |
| Maximum | 7.5% | 5.4% |
| Range | 6.8% | 4.9% |
| Mean | 1.5% | 2.5% |
| Median | 1.3% | 2.4% |
| Interquartile 25% (IQ1) | 1.1% | 2.0% |
| Interquartile 75% (IQ3) | 1.6% | 2.8% |
| Interquartile Range (IQR) | 0.47% | 0.88% |
| Standard Deviation (Sample) | 0.98% | 0.93% |
| Standard Deviation (Population) | 0.98% | 0.92% |
Similar Demographics by No Schooling Completed
Demographics Similar to Italians by No Schooling Completed
In terms of no schooling completed, the demographic groups most similar to Italians are Latvian (1.5%, a difference of 0.25%), Swiss (1.5%, a difference of 0.68%), Inupiat (1.5%, a difference of 1.1%), British (1.5%, a difference of 1.1%), and Eastern European (1.6%, a difference of 1.2%).
| Demographics | Rating | Rank | No Schooling Completed |
| Czechs | 100.0 /100 | #26 | Exceptional 1.5% |
| Scandinavians | 100.0 /100 | #27 | Exceptional 1.5% |
| French Canadians | 100.0 /100 | #28 | Exceptional 1.5% |
| Lumbee | 100.0 /100 | #29 | Exceptional 1.5% |
| British | 100.0 /100 | #30 | Exceptional 1.5% |
| Inupiat | 100.0 /100 | #31 | Exceptional 1.5% |
| Swiss | 100.0 /100 | #32 | Exceptional 1.5% |
| Italians | 100.0 /100 | #33 | Exceptional 1.5% |
| Latvians | 100.0 /100 | #34 | Exceptional 1.5% |
| Eastern Europeans | 100.0 /100 | #35 | Exceptional 1.6% |
| Aleuts | 99.9 /100 | #36 | Exceptional 1.6% |
| Belgians | 99.9 /100 | #37 | Exceptional 1.6% |
| Northern Europeans | 99.9 /100 | #38 | Exceptional 1.6% |
| Native Hawaiians | 99.9 /100 | #39 | Exceptional 1.6% |
| Luxembourgers | 99.9 /100 | #40 | Exceptional 1.6% |
Demographics Similar to Colombians by No Schooling Completed
In terms of no schooling completed, the demographic groups most similar to Colombians are Immigrants from Uruguay (2.3%, a difference of 0.22%), Puerto Rican (2.3%, a difference of 0.25%), Immigrants from Malaysia (2.3%, a difference of 0.36%), Immigrants from Pakistan (2.3%, a difference of 0.38%), and U.S. Virgin Islander (2.3%, a difference of 0.47%).
| Demographics | Rating | Rank | No Schooling Completed |
| Sudanese | 4.1 /100 | #225 | Tragic 2.3% |
| Sierra Leoneans | 4.1 /100 | #226 | Tragic 2.3% |
| Immigrants | Uganda | 4.0 /100 | #227 | Tragic 2.3% |
| U.S. Virgin Islanders | 3.7 /100 | #228 | Tragic 2.3% |
| Immigrants | Pakistan | 3.6 /100 | #229 | Tragic 2.3% |
| Puerto Ricans | 3.4 /100 | #230 | Tragic 2.3% |
| Immigrants | Uruguay | 3.4 /100 | #231 | Tragic 2.3% |
| Colombians | 3.2 /100 | #232 | Tragic 2.3% |
| Immigrants | Malaysia | 2.8 /100 | #233 | Tragic 2.3% |
| Nigerians | 2.6 /100 | #234 | Tragic 2.3% |
| Immigrants | Western Asia | 2.6 /100 | #235 | Tragic 2.3% |
| Iraqis | 2.2 /100 | #236 | Tragic 2.4% |
| Immigrants | Eastern Asia | 2.0 /100 | #237 | Tragic 2.4% |
| Paiute | 1.9 /100 | #238 | Tragic 2.4% |
| Liberians | 1.8 /100 | #239 | Tragic 2.4% |