Italian vs Immigrants from Turkey Unemployment Among Women with Children Under 18 years

COMPARE

Italian
Race
Ancestry
AfghanAfricanAlaska NativeAlaskan AthabascanAlbanianAleutAlsatianAmericanApacheArabArapahoArgentineanArmenianAssyrian/Chaldean/SyriacAustralianAustrianBahamianBangladeshiBarbadianBasqueBelgianBelizeanBermudanBhutaneseBlackfeetBolivianBrazilianBritishBritish West IndianBulgarianBurmeseCajunCambodianCanadianCape VerdeanCarpatho RusynCelticCentral AmericanCentral American IndianCherokeeCheyenneChickasawChileanChineseChippewaChoctawColombianColvilleComancheCosta RicanCreeCreekCroatianCrowCubanCypriotCzechCzechoslovakianDanishDelawareDominicanDutchDutch West IndianEastern EuropeanEcuadorianEgyptianEnglishEstonianEthiopianEuropeanFijianFilipinoFinnishFrenchFrench American IndianFrench CanadianGermanGerman RussianGhanaianGreekGuamanian/ChamorroGuatemalanGuyaneseHaitianHmongHonduranHopiHoumaHungarianIcelanderIndian (Asian)IndonesianInupiatIranianIraqiIrishIroquoisIsraeliItalianJamaicanJapaneseJordanianKenyanKiowaKoreanLaotianLatvianLebaneseLiberianLithuanianLumbeeLuxembourgerMacedonianMalaysianMalteseMarshalleseMenomineeMexicanMexican American IndianMongolianMoroccanNative HawaiianNavajoNepaleseNew ZealanderNicaraguanNigerianNorthern EuropeanNorwegianOkinawanOsageOttawaPaiutePakistaniPalestinianPanamanianParaguayanPennsylvania GermanPeruvianPimaPolishPortuguesePotawatomiPuebloPuerto RicanPuget Sound SalishRomanianRussianSalvadoranSamoanScandinavianScotch-IrishScottishSeminoleSenegaleseSerbianShoshoneSierra LeoneanSiouxSlavicSlovakSloveneSomaliSouth AfricanSouth AmericanSouth American IndianSoviet UnionSpaniardSpanishSpanish AmericanSpanish American IndianSri LankanSubsaharan AfricanSudaneseSwedishSwissSyrianTaiwaneseThaiTlingit-HaidaTohono O'OdhamTonganTrinidadian and TobagonianTsimshianTurkishU.S. Virgin IslanderUgandanUkrainianUruguayanUteVenezuelanVietnameseWelshWest IndianYakamaYaquiYugoslavianYumanYup'ikZimbabwean
Immigration
NonimmigrantsImmigrantsAfghanistanAfricaAlbaniaArgentinaArmeniaAsiaAustraliaAustriaBahamasBangladeshBarbadosBelarusBelgiumBelizeBoliviaBosnia and HerzegovinaBrazilBulgariaBurma/MyanmarCabo VerdeCambodiaCameroonCanadaCaribbeanCentral AmericaChileChinaColombiaCongoCosta RicaCroatiaCubaCzechoslovakiaDenmarkDominicaDominican RepublicEastern AfricaEastern AsiaEastern EuropeEcuadorEgyptEl SalvadorEnglandEritreaEthiopiaEuropeFijiFranceGermanyGhanaGreeceGrenadaGuatemalaGuyanaHaitiHondurasHong KongHungaryIndiaIndonesiaIranIraqIrelandIsraelItalyJamaicaJapanJordanKazakhstanKenyaKoreaKuwaitLaosLatin AmericaLatviaLebanonLiberiaLithuaniaMalaysiaMexicoMicronesiaMiddle AfricaMoldovaMoroccoNepalNetherlandsNicaraguaNigeriaNorth AmericaNorth MacedoniaNorthern AfricaNorthern EuropeNorwayOceaniaPakistanPanamaPeruPhilippinesPolandPortugalRomaniaRussiaSaudi ArabiaScotlandSenegalSerbiaSierra LeoneSingaporeSomaliaSouth AfricaSouth AmericaSouth Central AsiaSouth Eastern AsiaSouthern EuropeSpainSri LankaSt. Vincent and the GrenadinesSudanSwedenSwitzerlandSyriaTaiwanThailandTrinidad and TobagoUgandaUkraineUruguayUzbekistanVenezuelaVietnamWest IndiesWestern AfricaWestern AsiaWestern EuropeYemenZaireZimbabweAzores
Immigrants from Turkey
Race
Ancestry
AfghanAfricanAlaska NativeAlaskan AthabascanAlbanianAleutAlsatianAmericanApacheArabArapahoArgentineanArmenianAssyrian/Chaldean/SyriacAustralianAustrianBahamianBangladeshiBarbadianBasqueBelgianBelizeanBermudanBhutaneseBlackfeetBolivianBrazilianBritishBritish West IndianBulgarianBurmeseCajunCambodianCanadianCape VerdeanCarpatho RusynCelticCentral AmericanCentral American IndianCherokeeCheyenneChickasawChileanChineseChippewaChoctawColombianColvilleComancheCosta RicanCreeCreekCroatianCrowCubanCypriotCzechCzechoslovakianDanishDelawareDominicanDutchDutch West IndianEastern EuropeanEcuadorianEgyptianEnglishEstonianEthiopianEuropeanFijianFilipinoFinnishFrenchFrench American IndianFrench CanadianGermanGerman RussianGhanaianGreekGuamanian/ChamorroGuatemalanGuyaneseHaitianHmongHonduranHopiHoumaHungarianIcelanderIndian (Asian)IndonesianInupiatIranianIraqiIrishIroquoisIsraeliJamaicanJapaneseJordanianKenyanKiowaKoreanLaotianLatvianLebaneseLiberianLithuanianLumbeeLuxembourgerMacedonianMalaysianMalteseMarshalleseMenomineeMexicanMexican American IndianMongolianMoroccanNative HawaiianNavajoNepaleseNew ZealanderNicaraguanNigerianNorthern EuropeanNorwegianOkinawanOsageOttawaPaiutePakistaniPalestinianPanamanianParaguayanPennsylvania GermanPeruvianPimaPolishPortuguesePotawatomiPuebloPuerto RicanPuget Sound SalishRomanianRussianSalvadoranSamoanScandinavianScotch-IrishScottishSeminoleSenegaleseSerbianShoshoneSierra LeoneanSiouxSlavicSlovakSloveneSomaliSouth AfricanSouth AmericanSouth American IndianSoviet UnionSpaniardSpanishSpanish AmericanSpanish American IndianSri LankanSubsaharan AfricanSudaneseSwedishSwissSyrianTaiwaneseThaiTlingit-HaidaTohono O'OdhamTonganTrinidadian and TobagonianTsimshianTurkishU.S. Virgin IslanderUgandanUkrainianUruguayanUteVenezuelanVietnameseWelshWest IndianYakamaYaquiYugoslavianYumanYup'ikZimbabwean
Immigration
NonimmigrantsImmigrantsAfghanistanAfricaAlbaniaArgentinaArmeniaAsiaAustraliaAustriaBahamasBangladeshBarbadosBelarusBelgiumBelizeBoliviaBosnia and HerzegovinaBrazilBulgariaBurma/MyanmarCabo VerdeCambodiaCameroonCanadaCaribbeanCentral AmericaChileChinaColombiaCongoCosta RicaCroatiaCubaCzechoslovakiaDenmarkDominicaDominican RepublicEastern AfricaEastern AsiaEastern EuropeEcuadorEgyptEl SalvadorEnglandEritreaEthiopiaEuropeFijiFranceGermanyGhanaGreeceGrenadaGuatemalaGuyanaHaitiHondurasHong KongHungaryIndiaIndonesiaIranIraqIrelandIsraelItalyJamaicaJapanJordanKazakhstanKenyaKoreaKuwaitLaosLatin AmericaLatviaLebanonLiberiaLithuaniaMalaysiaMexicoMicronesiaMiddle AfricaMoldovaMoroccoNepalNetherlandsNicaraguaNigeriaNorth AmericaNorth MacedoniaNorthern AfricaNorthern EuropeNorwayOceaniaPakistanPanamaPeruPhilippinesPolandPortugalRomaniaRussiaSaudi ArabiaScotlandSenegalSerbiaSierra LeoneSingaporeSomaliaSouth AfricaSouth AmericaSouth Central AsiaSouth Eastern AsiaSouthern EuropeSpainSri LankaSt. Vincent and the GrenadinesSudanSwedenSwitzerlandSyriaTaiwanThailandTrinidad and TobagoTurkeyUgandaUkraineUruguayUzbekistanVenezuelaVietnamWest IndiesWestern AfricaWestern AsiaWestern EuropeYemenZaireZimbabweAzores
Unemployment Among Women with Children Under 18 years
Income
Poverty
Unemployment
Labor Participation
Family Structure
Vehicle Availability
Education Level
Disability

Unemployment Among Women with Children Under 18 years Comparison

Italians

Immigrants from Turkey

Exceptional
Exceptional
5.1%
UNEMPLOYMENT AMONG WOMEN WITH CHILDREN UNDER 18 YEARS
97.4/ 100
METRIC RATING
63rd/ 347
METRIC RANK
5.2%
UNEMPLOYMENT AMONG WOMEN WITH CHILDREN UNDER 18 YEARS
94.2/ 100
METRIC RATING
89th/ 347
METRIC RANK

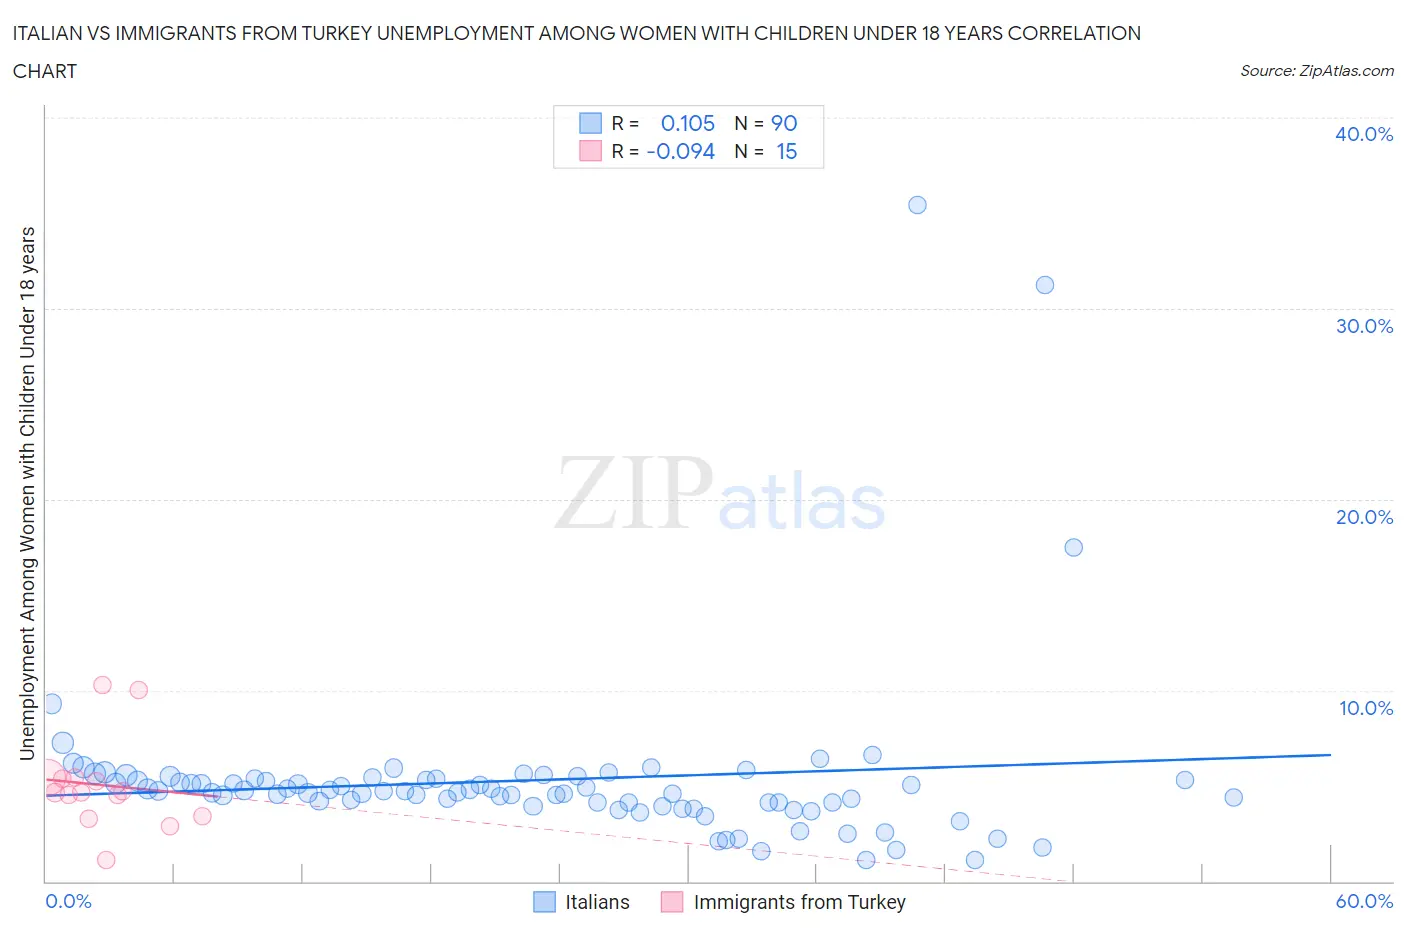
Italian vs Immigrants from Turkey Unemployment Among Women with Children Under 18 years Correlation Chart

The statistical analysis conducted on geographies consisting of 518,789,873 people shows a poor positive correlation between the proportion of Italians and unemployment rate among women with children under the age of 18 in the United States with a correlation coefficient (R) of 0.105 and weighted average of 5.1%. Similarly, the statistical analysis conducted on geographies consisting of 218,285,752 people shows a slight negative correlation between the proportion of Immigrants from Turkey and unemployment rate among women with children under the age of 18 in the United States with a correlation coefficient (R) of -0.094 and weighted average of 5.2%, a difference of 1.6%.
Italian vs Immigrants from Turkey Unemployment Among Women with Children Under 18 years

Unemployment Among Women with Children Under 18 years Correlation Summary

MeasurementItalianImmigrants from Turkey
Minimum1.1%1.1%
Maximum35.4%10.3%
Range34.3%9.2%
Mean5.3%5.0%
Median4.7%4.7%
Interquartile 25% (IQ1)4.1%3.4%
Interquartile 75% (IQ3)5.4%5.4%
Interquartile Range (IQR)1.3%2.0%
Standard Deviation (Sample)4.7%2.4%
Standard Deviation (Population)4.6%2.3%

Similar Demographics by Unemployment Among Women with Children Under 18 years

Demographics Similar to Italians by Unemployment Among Women with Children Under 18 years

In terms of unemployment among women with children under 18 years, the demographic groups most similar to Italians are Immigrants from Bulgaria (5.1%, a difference of 0.010%), Russian (5.1%, a difference of 0.080%), Estonian (5.1%, a difference of 0.17%), Immigrants from Sweden (5.1%, a difference of 0.19%), and Welsh (5.1%, a difference of 0.23%).
DemographicsRating | RankUnemployment Among Women with Children Under 18 years
Immigrants | Ireland
98.0
/100
|
#56
Exceptional
5.1%
Czechoslovakians
98.0
/100
|
#57
Exceptional
5.1%
Immigrants | Belgium
97.9
/100
|
#58
Exceptional
5.1%
Asians
97.9
/100
|
#59
Exceptional
5.1%
Welsh
97.7
/100
|
#60
Exceptional
5.1%
Russians
97.5
/100
|
#61
Exceptional
5.1%
Immigrants | Bulgaria
97.4
/100
|
#62
Exceptional
5.1%
Italians
97.4
/100
|
#63
Exceptional
5.1%
Estonians
97.2
/100
|
#64
Exceptional
5.1%
Immigrants | Sweden
97.1
/100
|
#65
Exceptional
5.1%
Immigrants | Australia
97.0
/100
|
#66
Exceptional
5.1%
Fijians
96.9
/100
|
#67
Exceptional
5.1%
Irish
96.8
/100
|
#68
Exceptional
5.1%
Austrians
96.6
/100
|
#69
Exceptional
5.1%
Icelanders
96.6
/100
|
#70
Exceptional
5.1%

Demographics Similar to Immigrants from Turkey by Unemployment Among Women with Children Under 18 years

In terms of unemployment among women with children under 18 years, the demographic groups most similar to Immigrants from Turkey are Immigrants from Scotland (5.2%, a difference of 0.10%), Ukrainian (5.2%, a difference of 0.13%), Laotian (5.2%, a difference of 0.17%), Immigrants from Indonesia (5.2%, a difference of 0.20%), and Paraguayan (5.2%, a difference of 0.21%).
DemographicsRating | RankUnemployment Among Women with Children Under 18 years
Romanians
95.3
/100
|
#82
Exceptional
5.2%
Maltese
95.1
/100
|
#83
Exceptional
5.2%
Australians
95.1
/100
|
#84
Exceptional
5.2%
Paraguayans
94.8
/100
|
#85
Exceptional
5.2%
Immigrants | Indonesia
94.8
/100
|
#86
Exceptional
5.2%
Laotians
94.7
/100
|
#87
Exceptional
5.2%
Immigrants | Scotland
94.5
/100
|
#88
Exceptional
5.2%
Immigrants | Turkey
94.2
/100
|
#89
Exceptional
5.2%
Ukrainians
93.8
/100
|
#90
Exceptional
5.2%
Immigrants | Zimbabwe
93.6
/100
|
#91
Exceptional
5.2%
Immigrants | Pakistan
93.3
/100
|
#92
Exceptional
5.2%
Immigrants | Canada
93.3
/100
|
#93
Exceptional
5.2%
Immigrants | Kuwait
92.6
/100
|
#94
Exceptional
5.2%
Immigrants | North America
92.3
/100
|
#95
Exceptional
5.2%
Immigrants | Albania
92.2
/100
|
#96
Exceptional
5.2%