Italian vs Korean Bachelor's Degree
COMPARE
Italian
Korean
Bachelor's Degree
Bachelor's Degree Comparison
Italians
Koreans
40.1%
BACHELOR'S DEGREE
91.9/ 100
METRIC RATING
131st/ 347
METRIC RANK
37.0%
BACHELOR'S DEGREE
29.8/ 100
METRIC RATING
195th/ 347
METRIC RANK
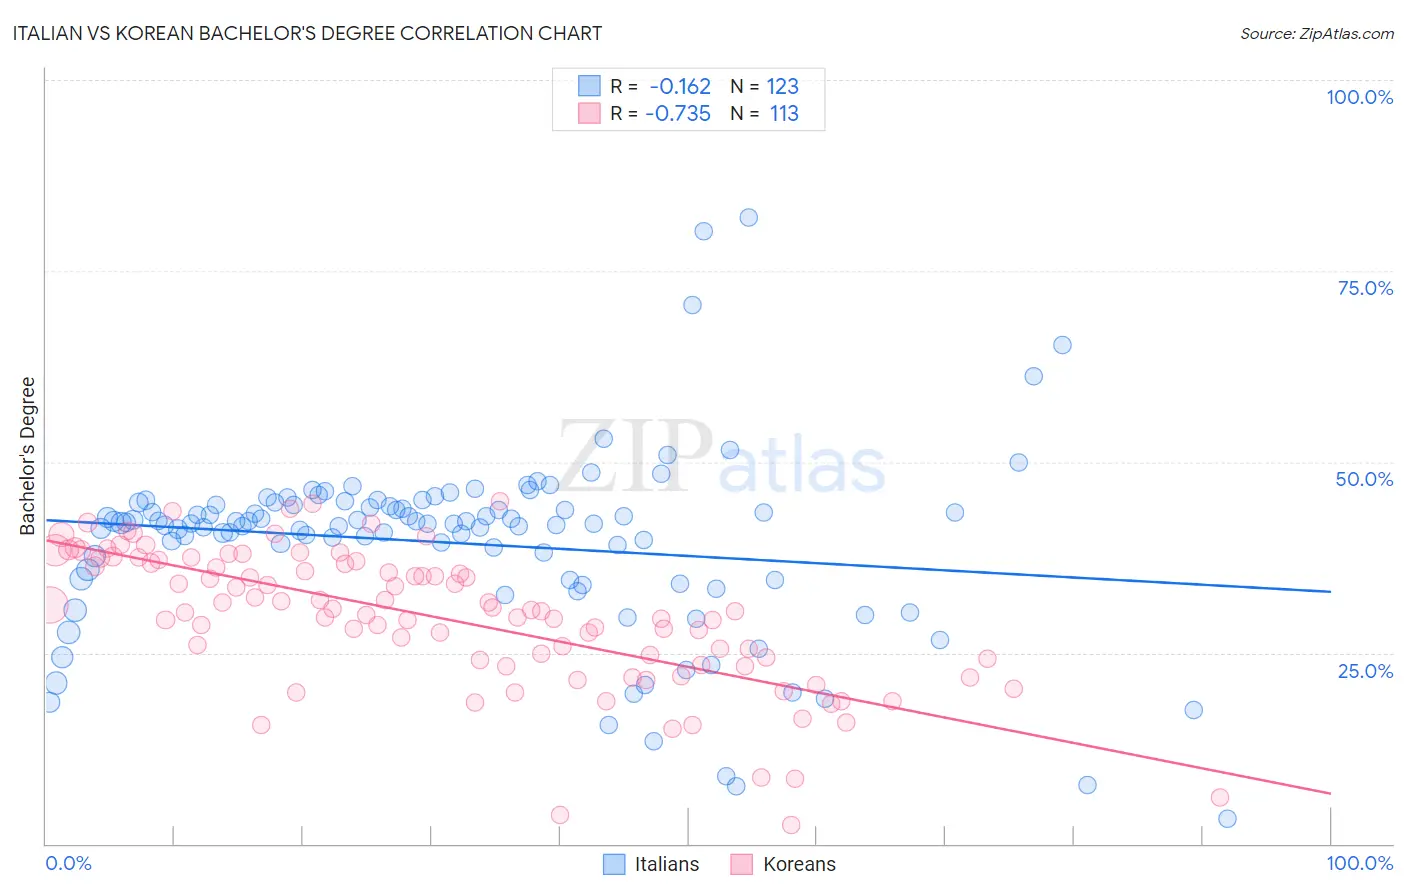
Italian vs Korean Bachelor's Degree Correlation Chart
The statistical analysis conducted on geographies consisting of 574,930,631 people shows a poor negative correlation between the proportion of Italians and percentage of population with at least bachelor's degree education in the United States with a correlation coefficient (R) of -0.162 and weighted average of 40.1%. Similarly, the statistical analysis conducted on geographies consisting of 510,872,242 people shows a strong negative correlation between the proportion of Koreans and percentage of population with at least bachelor's degree education in the United States with a correlation coefficient (R) of -0.735 and weighted average of 37.0%, a difference of 8.2%.
Bachelor's Degree Correlation Summary
| Measurement | Italian | Korean |
| Minimum | 3.2% | 2.5% |
| Maximum | 82.0% | 44.8% |
| Range | 78.7% | 42.3% |
| Mean | 39.3% | 29.6% |
| Median | 42.0% | 30.4% |
| Interquartile 25% (IQ1) | 34.5% | 23.7% |
| Interquartile 75% (IQ3) | 44.3% | 36.9% |
| Interquartile Range (IQR) | 9.8% | 13.2% |
| Standard Deviation (Sample) | 12.1% | 9.0% |
| Standard Deviation (Population) | 12.1% | 9.0% |
Similar Demographics by Bachelor's Degree
Demographics Similar to Italians by Bachelor's Degree
In terms of bachelor's degree, the demographic groups most similar to Italians are Sierra Leonean (40.1%, a difference of 0.080%), Serbian (40.1%, a difference of 0.15%), Taiwanese (40.0%, a difference of 0.25%), Immigrants from Southern Europe (40.0%, a difference of 0.25%), and Immigrants from Venezuela (40.2%, a difference of 0.32%).
| Demographics | Rating | Rank | Bachelor's Degree |
| Immigrants | Eritrea | 94.3 /100 | #124 | Exceptional 40.4% |
| British | 94.2 /100 | #125 | Exceptional 40.4% |
| Immigrants | Eastern Africa | 94.1 /100 | #126 | Exceptional 40.4% |
| Immigrants | Jordan | 93.4 /100 | #127 | Exceptional 40.3% |
| Immigrants | Venezuela | 92.9 /100 | #128 | Exceptional 40.2% |
| Serbians | 92.4 /100 | #129 | Exceptional 40.1% |
| Sierra Leoneans | 92.2 /100 | #130 | Exceptional 40.1% |
| Italians | 91.9 /100 | #131 | Exceptional 40.1% |
| Taiwanese | 91.1 /100 | #132 | Exceptional 40.0% |
| Immigrants | Southern Europe | 91.1 /100 | #133 | Exceptional 40.0% |
| Assyrians/Chaldeans/Syriacs | 89.4 /100 | #134 | Excellent 39.8% |
| Luxembourgers | 89.1 /100 | #135 | Excellent 39.8% |
| Pakistanis | 88.2 /100 | #136 | Excellent 39.7% |
| Icelanders | 86.5 /100 | #137 | Excellent 39.5% |
| Europeans | 85.6 /100 | #138 | Excellent 39.5% |
Demographics Similar to Koreans by Bachelor's Degree
In terms of bachelor's degree, the demographic groups most similar to Koreans are Belgian (37.0%, a difference of 0.010%), Celtic (37.0%, a difference of 0.030%), Czechoslovakian (37.0%, a difference of 0.070%), Welsh (37.0%, a difference of 0.080%), and Yugoslavian (37.1%, a difference of 0.20%).
| Demographics | Rating | Rank | Bachelor's Degree |
| Immigrants | Oceania | 37.3 /100 | #188 | Fair 37.3% |
| Slovaks | 36.9 /100 | #189 | Fair 37.3% |
| Swiss | 34.1 /100 | #190 | Fair 37.2% |
| Nigerians | 33.9 /100 | #191 | Fair 37.2% |
| Immigrants | Vietnam | 32.1 /100 | #192 | Fair 37.1% |
| Yugoslavians | 31.5 /100 | #193 | Fair 37.1% |
| Belgians | 29.9 /100 | #194 | Fair 37.0% |
| Koreans | 29.8 /100 | #195 | Fair 37.0% |
| Celtics | 29.5 /100 | #196 | Fair 37.0% |
| Czechoslovakians | 29.2 /100 | #197 | Fair 37.0% |
| Welsh | 29.1 /100 | #198 | Fair 37.0% |
| Immigrants | Costa Rica | 27.4 /100 | #199 | Fair 36.9% |
| Immigrants | Ghana | 27.4 /100 | #200 | Fair 36.9% |
| Immigrants | South Eastern Asia | 25.4 /100 | #201 | Fair 36.8% |
| Immigrants | Zaire | 25.3 /100 | #202 | Fair 36.8% |