Italian vs Guatemalan Bachelor's Degree
COMPARE
Italian
Guatemalan
Bachelor's Degree
Bachelor's Degree Comparison
Italians
Guatemalans
40.1%
BACHELOR'S DEGREE
91.9/ 100
METRIC RATING
131st/ 347
METRIC RANK
31.0%
BACHELOR'S DEGREE
0.1/ 100
METRIC RATING
288th/ 347
METRIC RANK
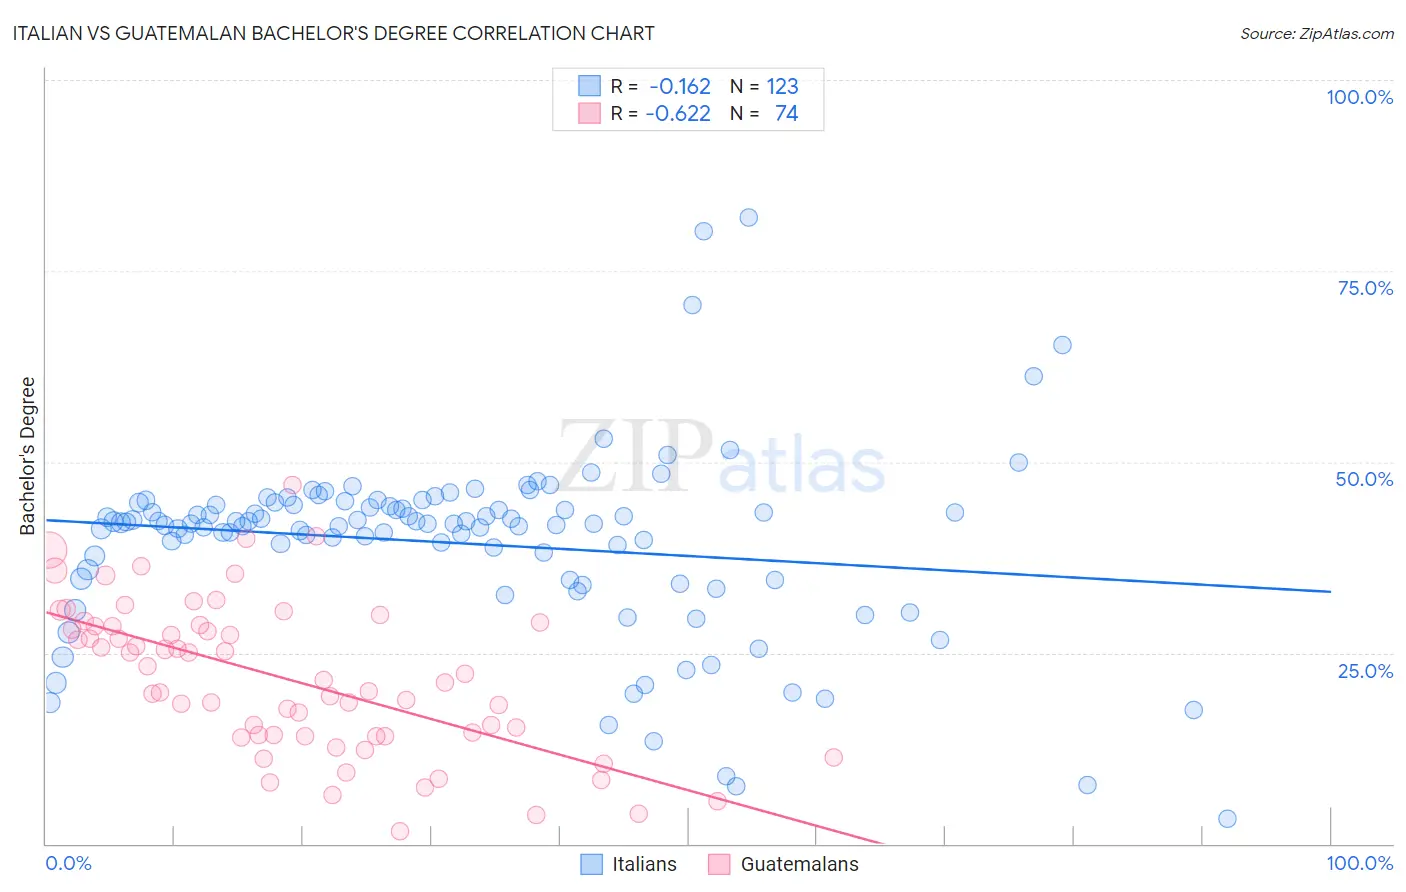
Italian vs Guatemalan Bachelor's Degree Correlation Chart
The statistical analysis conducted on geographies consisting of 574,930,631 people shows a poor negative correlation between the proportion of Italians and percentage of population with at least bachelor's degree education in the United States with a correlation coefficient (R) of -0.162 and weighted average of 40.1%. Similarly, the statistical analysis conducted on geographies consisting of 409,514,528 people shows a significant negative correlation between the proportion of Guatemalans and percentage of population with at least bachelor's degree education in the United States with a correlation coefficient (R) of -0.622 and weighted average of 31.0%, a difference of 29.2%.
Bachelor's Degree Correlation Summary
| Measurement | Italian | Guatemalan |
| Minimum | 3.2% | 1.7% |
| Maximum | 82.0% | 47.0% |
| Range | 78.7% | 45.3% |
| Mean | 39.3% | 21.6% |
| Median | 42.0% | 21.3% |
| Interquartile 25% (IQ1) | 34.5% | 14.1% |
| Interquartile 75% (IQ3) | 44.3% | 28.5% |
| Interquartile Range (IQR) | 9.8% | 14.3% |
| Standard Deviation (Sample) | 12.1% | 9.9% |
| Standard Deviation (Population) | 12.1% | 9.8% |
Similar Demographics by Bachelor's Degree
Demographics Similar to Italians by Bachelor's Degree
In terms of bachelor's degree, the demographic groups most similar to Italians are Sierra Leonean (40.1%, a difference of 0.080%), Serbian (40.1%, a difference of 0.15%), Taiwanese (40.0%, a difference of 0.25%), Immigrants from Southern Europe (40.0%, a difference of 0.25%), and Immigrants from Venezuela (40.2%, a difference of 0.32%).
| Demographics | Rating | Rank | Bachelor's Degree |
| Immigrants | Eritrea | 94.3 /100 | #124 | Exceptional 40.4% |
| British | 94.2 /100 | #125 | Exceptional 40.4% |
| Immigrants | Eastern Africa | 94.1 /100 | #126 | Exceptional 40.4% |
| Immigrants | Jordan | 93.4 /100 | #127 | Exceptional 40.3% |
| Immigrants | Venezuela | 92.9 /100 | #128 | Exceptional 40.2% |
| Serbians | 92.4 /100 | #129 | Exceptional 40.1% |
| Sierra Leoneans | 92.2 /100 | #130 | Exceptional 40.1% |
| Italians | 91.9 /100 | #131 | Exceptional 40.1% |
| Taiwanese | 91.1 /100 | #132 | Exceptional 40.0% |
| Immigrants | Southern Europe | 91.1 /100 | #133 | Exceptional 40.0% |
| Assyrians/Chaldeans/Syriacs | 89.4 /100 | #134 | Excellent 39.8% |
| Luxembourgers | 89.1 /100 | #135 | Excellent 39.8% |
| Pakistanis | 88.2 /100 | #136 | Excellent 39.7% |
| Icelanders | 86.5 /100 | #137 | Excellent 39.5% |
| Europeans | 85.6 /100 | #138 | Excellent 39.5% |
Demographics Similar to Guatemalans by Bachelor's Degree
In terms of bachelor's degree, the demographic groups most similar to Guatemalans are Puerto Rican (31.0%, a difference of 0.14%), Immigrants from Honduras (30.9%, a difference of 0.18%), Black/African American (30.9%, a difference of 0.22%), Ute (30.9%, a difference of 0.30%), and Ottawa (31.1%, a difference of 0.36%).
| Demographics | Rating | Rank | Bachelor's Degree |
| Blackfeet | 0.1 /100 | #281 | Tragic 31.5% |
| Immigrants | Caribbean | 0.1 /100 | #282 | Tragic 31.4% |
| Hondurans | 0.1 /100 | #283 | Tragic 31.3% |
| Haitians | 0.1 /100 | #284 | Tragic 31.3% |
| Aleuts | 0.1 /100 | #285 | Tragic 31.3% |
| Immigrants | El Salvador | 0.1 /100 | #286 | Tragic 31.3% |
| Ottawa | 0.1 /100 | #287 | Tragic 31.1% |
| Guatemalans | 0.1 /100 | #288 | Tragic 31.0% |
| Puerto Ricans | 0.1 /100 | #289 | Tragic 31.0% |
| Immigrants | Honduras | 0.1 /100 | #290 | Tragic 30.9% |
| Blacks/African Americans | 0.1 /100 | #291 | Tragic 30.9% |
| Ute | 0.1 /100 | #292 | Tragic 30.9% |
| Cape Verdeans | 0.1 /100 | #293 | Tragic 30.9% |
| Immigrants | Guatemala | 0.0 /100 | #294 | Tragic 30.8% |
| Immigrants | Dominican Republic | 0.0 /100 | #295 | Tragic 30.7% |