Italian vs Scotch-Irish Bachelor's Degree
COMPARE
Italian
Scotch-Irish
Bachelor's Degree
Bachelor's Degree Comparison
Italians
Scotch-Irish
40.1%
BACHELOR'S DEGREE
91.9/ 100
METRIC RATING
131st/ 347
METRIC RANK
36.4%
BACHELOR'S DEGREE
18.3/ 100
METRIC RATING
211th/ 347
METRIC RANK
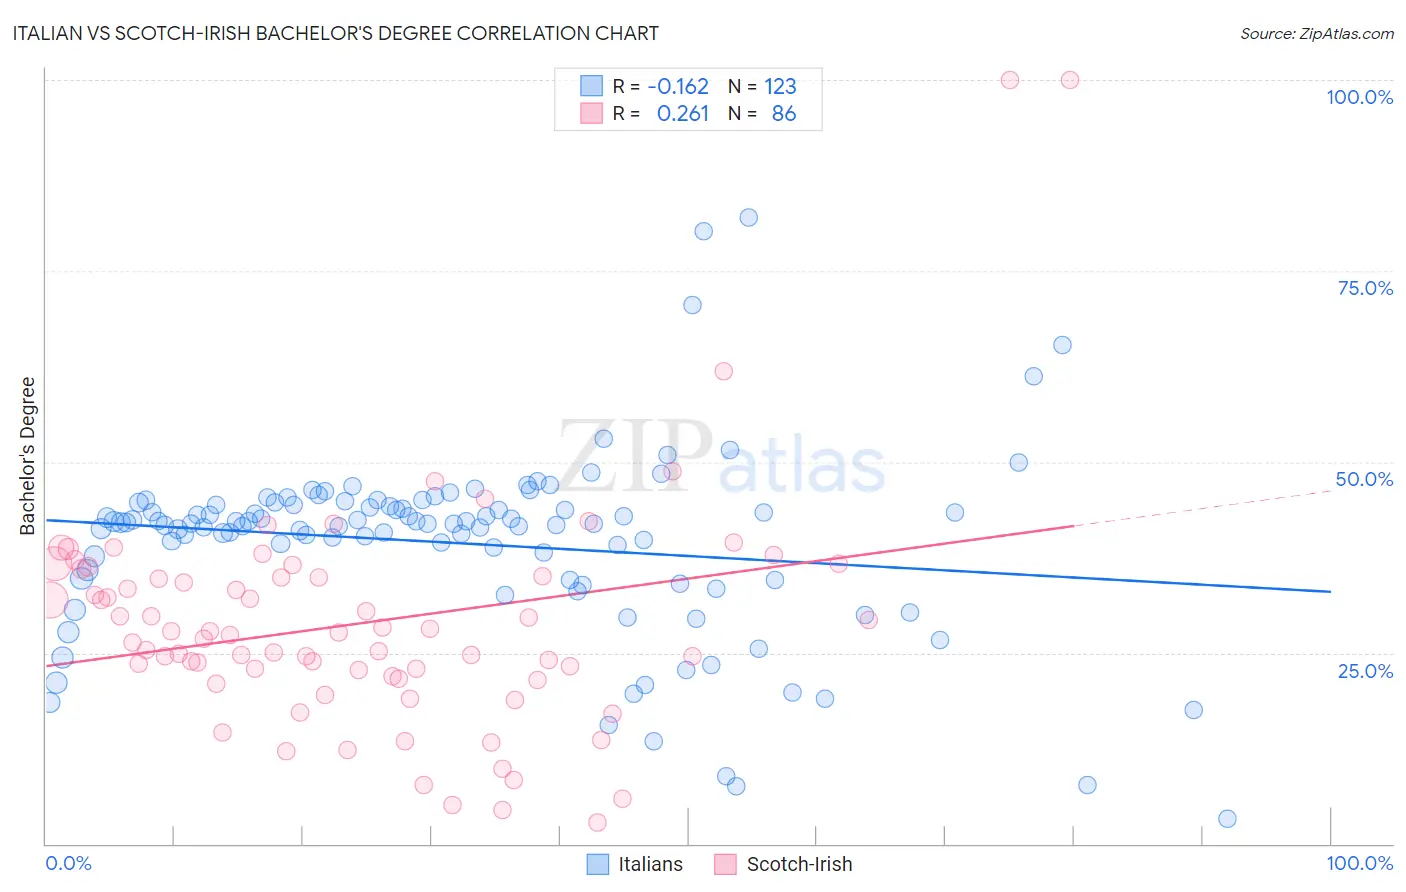
Italian vs Scotch-Irish Bachelor's Degree Correlation Chart
The statistical analysis conducted on geographies consisting of 574,930,631 people shows a poor negative correlation between the proportion of Italians and percentage of population with at least bachelor's degree education in the United States with a correlation coefficient (R) of -0.162 and weighted average of 40.1%. Similarly, the statistical analysis conducted on geographies consisting of 548,685,901 people shows a weak positive correlation between the proportion of Scotch-Irish and percentage of population with at least bachelor's degree education in the United States with a correlation coefficient (R) of 0.261 and weighted average of 36.4%, a difference of 9.9%.
Bachelor's Degree Correlation Summary
| Measurement | Italian | Scotch-Irish |
| Minimum | 3.2% | 2.9% |
| Maximum | 82.0% | 100.0% |
| Range | 78.7% | 97.1% |
| Mean | 39.3% | 28.9% |
| Median | 42.0% | 27.5% |
| Interquartile 25% (IQ1) | 34.5% | 21.9% |
| Interquartile 75% (IQ3) | 44.3% | 35.1% |
| Interquartile Range (IQR) | 9.8% | 13.2% |
| Standard Deviation (Sample) | 12.1% | 15.4% |
| Standard Deviation (Population) | 12.1% | 15.3% |
Similar Demographics by Bachelor's Degree
Demographics Similar to Italians by Bachelor's Degree
In terms of bachelor's degree, the demographic groups most similar to Italians are Sierra Leonean (40.1%, a difference of 0.080%), Serbian (40.1%, a difference of 0.15%), Taiwanese (40.0%, a difference of 0.25%), Immigrants from Southern Europe (40.0%, a difference of 0.25%), and Immigrants from Venezuela (40.2%, a difference of 0.32%).
| Demographics | Rating | Rank | Bachelor's Degree |
| Immigrants | Eritrea | 94.3 /100 | #124 | Exceptional 40.4% |
| British | 94.2 /100 | #125 | Exceptional 40.4% |
| Immigrants | Eastern Africa | 94.1 /100 | #126 | Exceptional 40.4% |
| Immigrants | Jordan | 93.4 /100 | #127 | Exceptional 40.3% |
| Immigrants | Venezuela | 92.9 /100 | #128 | Exceptional 40.2% |
| Serbians | 92.4 /100 | #129 | Exceptional 40.1% |
| Sierra Leoneans | 92.2 /100 | #130 | Exceptional 40.1% |
| Italians | 91.9 /100 | #131 | Exceptional 40.1% |
| Taiwanese | 91.1 /100 | #132 | Exceptional 40.0% |
| Immigrants | Southern Europe | 91.1 /100 | #133 | Exceptional 40.0% |
| Assyrians/Chaldeans/Syriacs | 89.4 /100 | #134 | Excellent 39.8% |
| Luxembourgers | 89.1 /100 | #135 | Excellent 39.8% |
| Pakistanis | 88.2 /100 | #136 | Excellent 39.7% |
| Icelanders | 86.5 /100 | #137 | Excellent 39.5% |
| Europeans | 85.6 /100 | #138 | Excellent 39.5% |
Demographics Similar to Scotch-Irish by Bachelor's Degree
In terms of bachelor's degree, the demographic groups most similar to Scotch-Irish are French (36.5%, a difference of 0.050%), Panamanian (36.5%, a difference of 0.080%), Immigrants from Philippines (36.4%, a difference of 0.080%), Immigrants from Thailand (36.5%, a difference of 0.18%), and Immigrants from Middle Africa (36.6%, a difference of 0.38%).
| Demographics | Rating | Rank | Bachelor's Degree |
| Immigrants | Immigrants | 22.8 /100 | #204 | Fair 36.7% |
| Finns | 22.2 /100 | #205 | Fair 36.7% |
| Spaniards | 21.2 /100 | #206 | Fair 36.6% |
| Immigrants | Middle Africa | 20.6 /100 | #207 | Fair 36.6% |
| Immigrants | Thailand | 19.4 /100 | #208 | Poor 36.5% |
| Panamanians | 18.8 /100 | #209 | Poor 36.5% |
| French | 18.6 /100 | #210 | Poor 36.5% |
| Scotch-Irish | 18.3 /100 | #211 | Poor 36.4% |
| Immigrants | Philippines | 17.8 /100 | #212 | Poor 36.4% |
| Immigrants | Panama | 14.2 /100 | #213 | Poor 36.2% |
| Germans | 13.9 /100 | #214 | Poor 36.1% |
| Immigrants | Western Africa | 13.8 /100 | #215 | Poor 36.1% |
| Barbadians | 13.5 /100 | #216 | Poor 36.1% |
| German Russians | 10.2 /100 | #217 | Poor 35.8% |
| Sub-Saharan Africans | 9.8 /100 | #218 | Tragic 35.8% |