Israeli vs Thai Professional Degree
COMPARE
Israeli
Thai
Professional Degree
Professional Degree Comparison
Israelis
Thais
6.9%
PROFESSIONAL DEGREE
100.0/ 100
METRIC RATING
12th/ 347
METRIC RANK
6.1%
PROFESSIONAL DEGREE
100.0/ 100
METRIC RATING
32nd/ 347
METRIC RANK
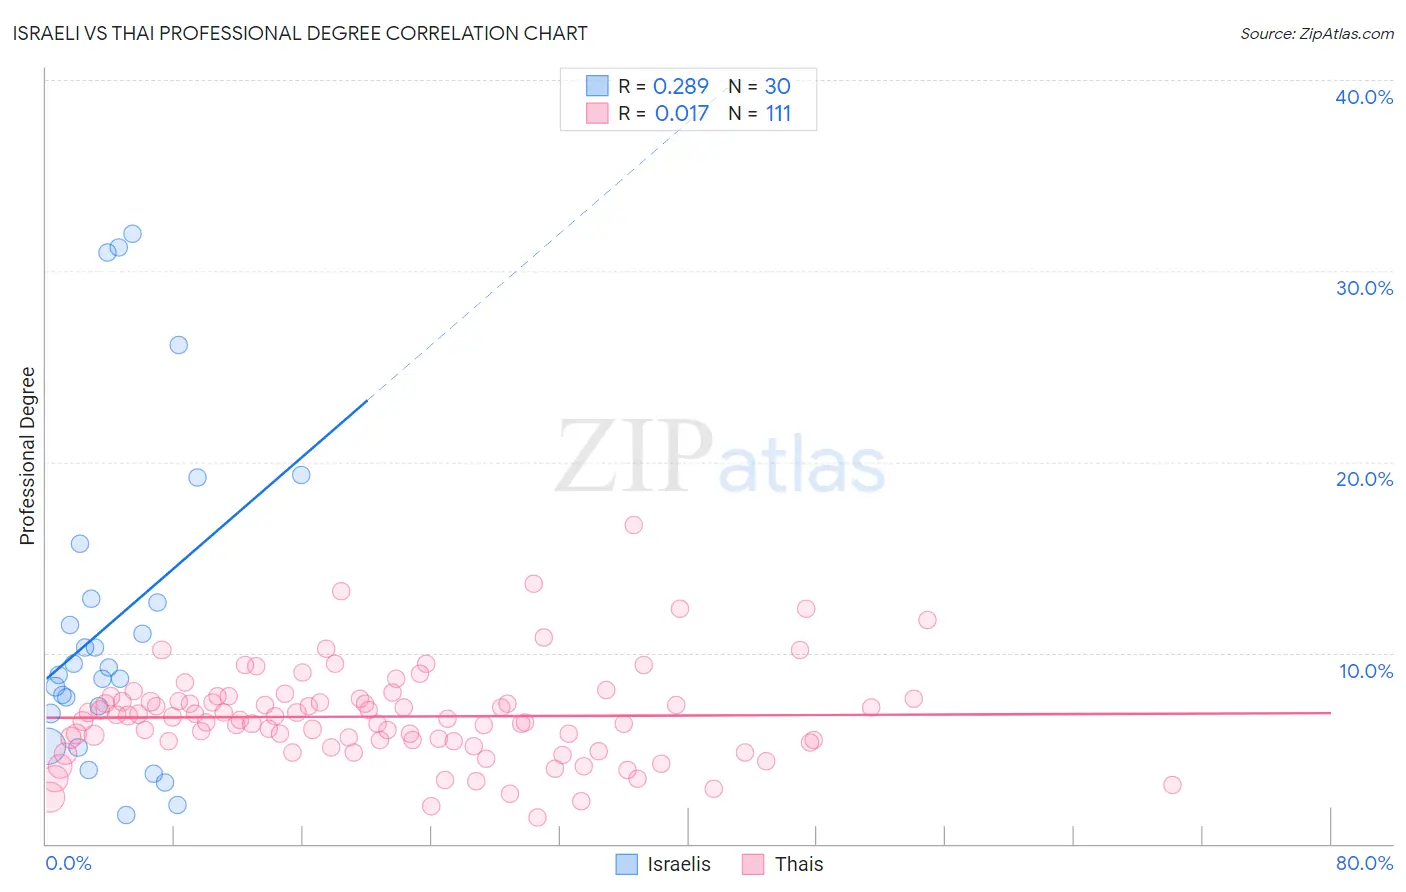
Israeli vs Thai Professional Degree Correlation Chart
The statistical analysis conducted on geographies consisting of 210,967,538 people shows a weak positive correlation between the proportion of Israelis and percentage of population with at least professional degree education in the United States with a correlation coefficient (R) of 0.289 and weighted average of 6.9%. Similarly, the statistical analysis conducted on geographies consisting of 474,458,456 people shows no correlation between the proportion of Thais and percentage of population with at least professional degree education in the United States with a correlation coefficient (R) of 0.017 and weighted average of 6.1%, a difference of 12.8%.
Professional Degree Correlation Summary
| Measurement | Israeli | Thai |
| Minimum | 1.5% | 1.4% |
| Maximum | 31.9% | 16.7% |
| Range | 30.5% | 15.3% |
| Mean | 11.7% | 6.7% |
| Median | 9.0% | 6.6% |
| Interquartile 25% (IQ1) | 6.8% | 5.3% |
| Interquartile 75% (IQ3) | 12.9% | 7.6% |
| Interquartile Range (IQR) | 6.0% | 2.3% |
| Standard Deviation (Sample) | 8.5% | 2.5% |
| Standard Deviation (Population) | 8.4% | 2.5% |
Demographics Similar to Israelis and Thais by Professional Degree
In terms of professional degree, the demographic groups most similar to Israelis are Immigrants from Australia (6.9%, a difference of 0.43%), Immigrants from France (6.8%, a difference of 1.9%), Immigrants from China (6.7%, a difference of 3.0%), Immigrants from Sweden (6.7%, a difference of 3.5%), and Immigrants from Eastern Asia (6.6%, a difference of 5.6%). Similarly, the demographic groups most similar to Thais are Immigrants from India (6.2%, a difference of 0.23%), Immigrants from Sri Lanka (6.2%, a difference of 0.35%), Immigrants from Turkey (6.2%, a difference of 0.35%), Turkish (6.2%, a difference of 0.99%), and Immigrants from Northern Europe (6.2%, a difference of 1.1%).
| Demographics | Rating | Rank | Professional Degree |
| Israelis | 100.0 /100 | #12 | Exceptional 6.9% |
| Immigrants | Australia | 100.0 /100 | #13 | Exceptional 6.9% |
| Immigrants | France | 100.0 /100 | #14 | Exceptional 6.8% |
| Immigrants | China | 100.0 /100 | #15 | Exceptional 6.7% |
| Immigrants | Sweden | 100.0 /100 | #16 | Exceptional 6.7% |
| Immigrants | Eastern Asia | 100.0 /100 | #17 | Exceptional 6.6% |
| Soviet Union | 100.0 /100 | #18 | Exceptional 6.6% |
| Indians (Asian) | 100.0 /100 | #19 | Exceptional 6.5% |
| Immigrants | Denmark | 100.0 /100 | #20 | Exceptional 6.4% |
| Immigrants | Hong Kong | 100.0 /100 | #21 | Exceptional 6.4% |
| Immigrants | Japan | 100.0 /100 | #22 | Exceptional 6.4% |
| Russians | 100.0 /100 | #23 | Exceptional 6.3% |
| Immigrants | Spain | 100.0 /100 | #24 | Exceptional 6.3% |
| Immigrants | Ireland | 100.0 /100 | #25 | Exceptional 6.3% |
| Latvians | 100.0 /100 | #26 | Exceptional 6.2% |
| Immigrants | Northern Europe | 100.0 /100 | #27 | Exceptional 6.2% |
| Turks | 100.0 /100 | #28 | Exceptional 6.2% |
| Immigrants | Sri Lanka | 100.0 /100 | #29 | Exceptional 6.2% |
| Immigrants | Turkey | 100.0 /100 | #30 | Exceptional 6.2% |
| Immigrants | India | 100.0 /100 | #31 | Exceptional 6.2% |
| Thais | 100.0 /100 | #32 | Exceptional 6.1% |