Israeli vs Alaskan Athabascan Bachelor's Degree
COMPARE
Israeli
Alaskan Athabascan
Bachelor's Degree
Bachelor's Degree Comparison
Israelis
Alaskan Athabascans
46.1%
BACHELOR'S DEGREE
100.0/ 100
METRIC RATING
29th/ 347
METRIC RANK
28.8%
BACHELOR'S DEGREE
0.0/ 100
METRIC RATING
321st/ 347
METRIC RANK
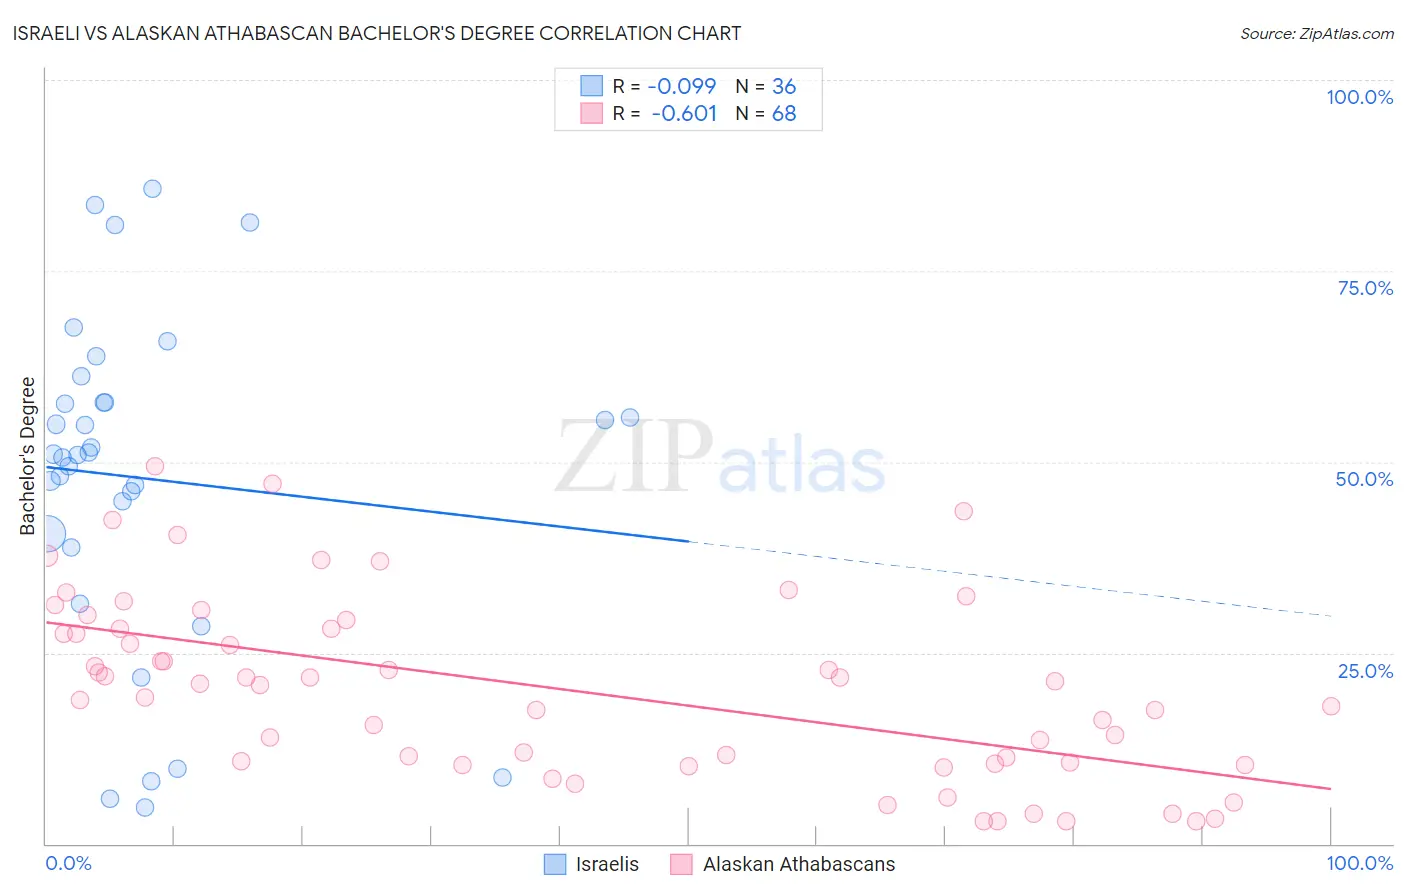
Israeli vs Alaskan Athabascan Bachelor's Degree Correlation Chart
The statistical analysis conducted on geographies consisting of 211,181,200 people shows a slight negative correlation between the proportion of Israelis and percentage of population with at least bachelor's degree education in the United States with a correlation coefficient (R) of -0.099 and weighted average of 46.1%. Similarly, the statistical analysis conducted on geographies consisting of 45,819,303 people shows a significant negative correlation between the proportion of Alaskan Athabascans and percentage of population with at least bachelor's degree education in the United States with a correlation coefficient (R) of -0.601 and weighted average of 28.8%, a difference of 60.1%.
Bachelor's Degree Correlation Summary
| Measurement | Israeli | Alaskan Athabascan |
| Minimum | 4.8% | 2.9% |
| Maximum | 85.8% | 49.4% |
| Range | 80.9% | 46.5% |
| Mean | 47.8% | 20.3% |
| Median | 51.0% | 20.9% |
| Interquartile 25% (IQ1) | 39.7% | 10.6% |
| Interquartile 75% (IQ3) | 57.8% | 28.2% |
| Interquartile Range (IQR) | 18.1% | 17.6% |
| Standard Deviation (Sample) | 21.6% | 11.8% |
| Standard Deviation (Population) | 21.3% | 11.7% |
Similar Demographics by Bachelor's Degree
Demographics Similar to Israelis by Bachelor's Degree
In terms of bachelor's degree, the demographic groups most similar to Israelis are Immigrants from Sri Lanka (46.1%, a difference of 0.050%), Latvian (46.1%, a difference of 0.090%), Turkish (46.2%, a difference of 0.13%), Immigrants from Turkey (46.0%, a difference of 0.39%), and Immigrants from France (46.4%, a difference of 0.59%).
| Demographics | Rating | Rank | Bachelor's Degree |
| Immigrants | Belgium | 100.0 /100 | #22 | Exceptional 47.0% |
| Immigrants | Sweden | 100.0 /100 | #23 | Exceptional 47.0% |
| Immigrants | Korea | 100.0 /100 | #24 | Exceptional 47.0% |
| Burmese | 100.0 /100 | #25 | Exceptional 46.9% |
| Immigrants | Japan | 100.0 /100 | #26 | Exceptional 46.8% |
| Immigrants | France | 100.0 /100 | #27 | Exceptional 46.4% |
| Turks | 100.0 /100 | #28 | Exceptional 46.2% |
| Israelis | 100.0 /100 | #29 | Exceptional 46.1% |
| Immigrants | Sri Lanka | 100.0 /100 | #30 | Exceptional 46.1% |
| Latvians | 100.0 /100 | #31 | Exceptional 46.1% |
| Immigrants | Turkey | 100.0 /100 | #32 | Exceptional 46.0% |
| Immigrants | Northern Europe | 100.0 /100 | #33 | Exceptional 45.6% |
| Immigrants | Denmark | 100.0 /100 | #34 | Exceptional 45.4% |
| Immigrants | Russia | 100.0 /100 | #35 | Exceptional 45.4% |
| Mongolians | 100.0 /100 | #36 | Exceptional 45.4% |
Demographics Similar to Alaskan Athabascans by Bachelor's Degree
In terms of bachelor's degree, the demographic groups most similar to Alaskan Athabascans are Kiowa (28.8%, a difference of 0.080%), Creek (28.9%, a difference of 0.13%), Tsimshian (28.8%, a difference of 0.22%), Fijian (28.7%, a difference of 0.36%), and Yaqui (29.0%, a difference of 0.58%).
| Demographics | Rating | Rank | Bachelor's Degree |
| Shoshone | 0.0 /100 | #314 | Tragic 29.3% |
| Immigrants | Cabo Verde | 0.0 /100 | #315 | Tragic 29.2% |
| Sioux | 0.0 /100 | #316 | Tragic 29.1% |
| Colville | 0.0 /100 | #317 | Tragic 29.0% |
| Yaqui | 0.0 /100 | #318 | Tragic 29.0% |
| Creek | 0.0 /100 | #319 | Tragic 28.9% |
| Kiowa | 0.0 /100 | #320 | Tragic 28.8% |
| Alaskan Athabascans | 0.0 /100 | #321 | Tragic 28.8% |
| Tsimshian | 0.0 /100 | #322 | Tragic 28.8% |
| Fijians | 0.0 /100 | #323 | Tragic 28.7% |
| Dutch West Indians | 0.0 /100 | #324 | Tragic 28.5% |
| Pennsylvania Germans | 0.0 /100 | #325 | Tragic 28.4% |
| Apache | 0.0 /100 | #326 | Tragic 28.3% |
| Paiute | 0.0 /100 | #327 | Tragic 28.1% |
| Crow | 0.0 /100 | #328 | Tragic 27.7% |