Israeli vs Immigrants from Western Africa Bachelor's Degree
COMPARE
Israeli
Immigrants from Western Africa
Bachelor's Degree
Bachelor's Degree Comparison
Israelis
Immigrants from Western Africa
46.1%
BACHELOR'S DEGREE
100.0/ 100
METRIC RATING
29th/ 347
METRIC RANK
36.1%
BACHELOR'S DEGREE
13.8/ 100
METRIC RATING
215th/ 347
METRIC RANK
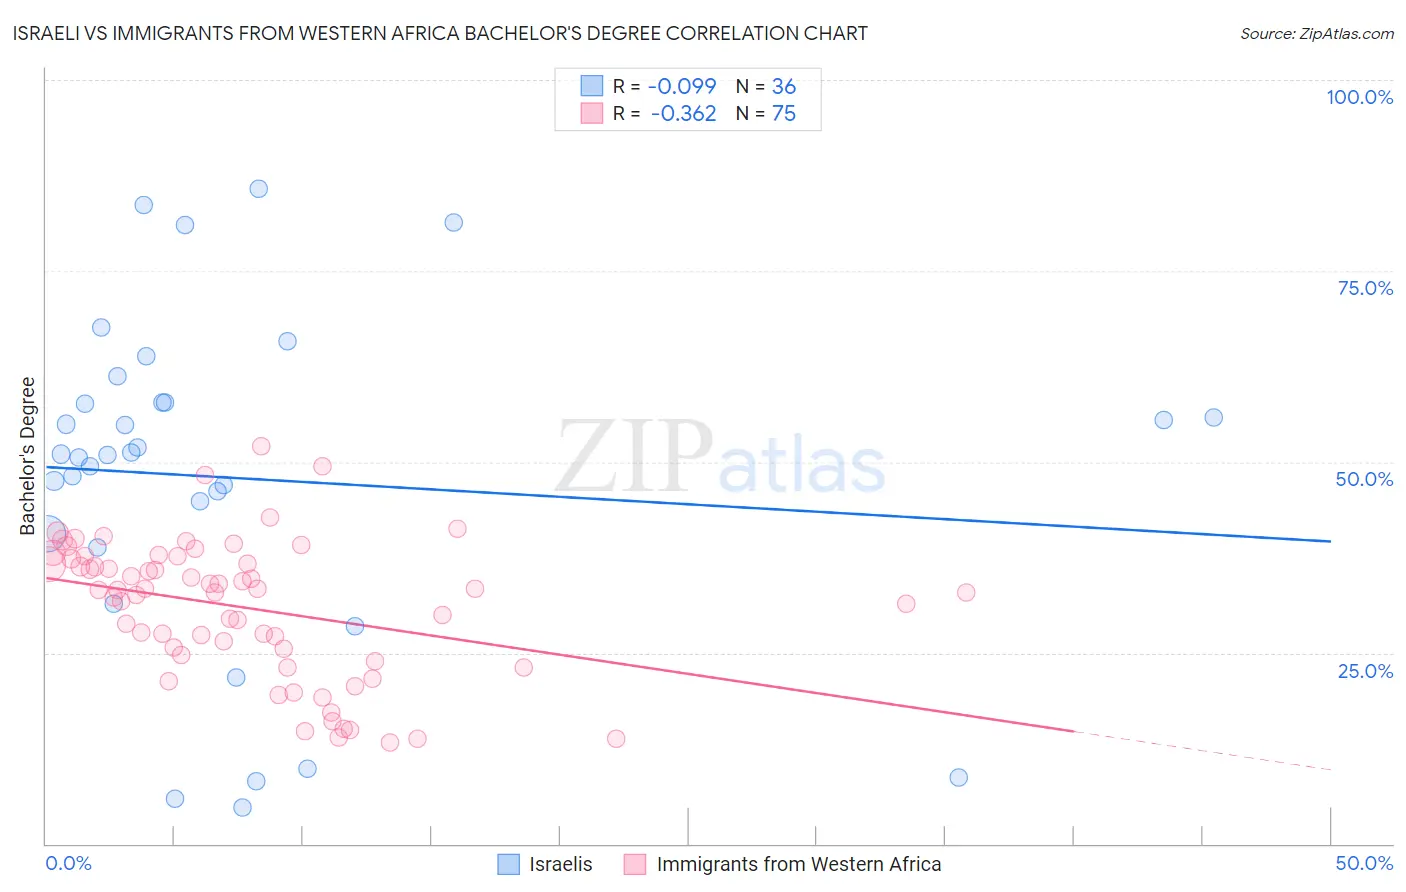
Israeli vs Immigrants from Western Africa Bachelor's Degree Correlation Chart
The statistical analysis conducted on geographies consisting of 211,181,200 people shows a slight negative correlation between the proportion of Israelis and percentage of population with at least bachelor's degree education in the United States with a correlation coefficient (R) of -0.099 and weighted average of 46.1%. Similarly, the statistical analysis conducted on geographies consisting of 357,836,949 people shows a mild negative correlation between the proportion of Immigrants from Western Africa and percentage of population with at least bachelor's degree education in the United States with a correlation coefficient (R) of -0.362 and weighted average of 36.1%, a difference of 27.6%.
Bachelor's Degree Correlation Summary
| Measurement | Israeli | Immigrants from Western Africa |
| Minimum | 4.8% | 13.3% |
| Maximum | 85.8% | 52.0% |
| Range | 80.9% | 38.8% |
| Mean | 47.8% | 30.9% |
| Median | 51.0% | 33.2% |
| Interquartile 25% (IQ1) | 39.7% | 24.6% |
| Interquartile 75% (IQ3) | 57.8% | 37.3% |
| Interquartile Range (IQR) | 18.1% | 12.6% |
| Standard Deviation (Sample) | 21.6% | 9.0% |
| Standard Deviation (Population) | 21.3% | 8.9% |
Similar Demographics by Bachelor's Degree
Demographics Similar to Israelis by Bachelor's Degree
In terms of bachelor's degree, the demographic groups most similar to Israelis are Immigrants from Sri Lanka (46.1%, a difference of 0.050%), Latvian (46.1%, a difference of 0.090%), Turkish (46.2%, a difference of 0.13%), Immigrants from Turkey (46.0%, a difference of 0.39%), and Immigrants from France (46.4%, a difference of 0.59%).
| Demographics | Rating | Rank | Bachelor's Degree |
| Immigrants | Belgium | 100.0 /100 | #22 | Exceptional 47.0% |
| Immigrants | Sweden | 100.0 /100 | #23 | Exceptional 47.0% |
| Immigrants | Korea | 100.0 /100 | #24 | Exceptional 47.0% |
| Burmese | 100.0 /100 | #25 | Exceptional 46.9% |
| Immigrants | Japan | 100.0 /100 | #26 | Exceptional 46.8% |
| Immigrants | France | 100.0 /100 | #27 | Exceptional 46.4% |
| Turks | 100.0 /100 | #28 | Exceptional 46.2% |
| Israelis | 100.0 /100 | #29 | Exceptional 46.1% |
| Immigrants | Sri Lanka | 100.0 /100 | #30 | Exceptional 46.1% |
| Latvians | 100.0 /100 | #31 | Exceptional 46.1% |
| Immigrants | Turkey | 100.0 /100 | #32 | Exceptional 46.0% |
| Immigrants | Northern Europe | 100.0 /100 | #33 | Exceptional 45.6% |
| Immigrants | Denmark | 100.0 /100 | #34 | Exceptional 45.4% |
| Immigrants | Russia | 100.0 /100 | #35 | Exceptional 45.4% |
| Mongolians | 100.0 /100 | #36 | Exceptional 45.4% |
Demographics Similar to Immigrants from Western Africa by Bachelor's Degree
In terms of bachelor's degree, the demographic groups most similar to Immigrants from Western Africa are German (36.1%, a difference of 0.030%), Barbadian (36.1%, a difference of 0.060%), Immigrants from Panama (36.2%, a difference of 0.10%), Immigrants from Philippines (36.4%, a difference of 0.78%), and Scotch-Irish (36.4%, a difference of 0.86%).
| Demographics | Rating | Rank | Bachelor's Degree |
| Immigrants | Thailand | 19.4 /100 | #208 | Poor 36.5% |
| Panamanians | 18.8 /100 | #209 | Poor 36.5% |
| French | 18.6 /100 | #210 | Poor 36.5% |
| Scotch-Irish | 18.3 /100 | #211 | Poor 36.4% |
| Immigrants | Philippines | 17.8 /100 | #212 | Poor 36.4% |
| Immigrants | Panama | 14.2 /100 | #213 | Poor 36.2% |
| Germans | 13.9 /100 | #214 | Poor 36.1% |
| Immigrants | Western Africa | 13.8 /100 | #215 | Poor 36.1% |
| Barbadians | 13.5 /100 | #216 | Poor 36.1% |
| German Russians | 10.2 /100 | #217 | Poor 35.8% |
| Sub-Saharan Africans | 9.8 /100 | #218 | Tragic 35.8% |
| West Indians | 9.7 /100 | #219 | Tragic 35.8% |
| Spanish | 9.6 /100 | #220 | Tragic 35.8% |
| Dutch | 9.2 /100 | #221 | Tragic 35.7% |
| Trinidadians and Tobagonians | 8.8 /100 | #222 | Tragic 35.7% |