Immigrants from Norway vs Alaskan Athabascan Bachelor's Degree
COMPARE
Immigrants from Norway
Alaskan Athabascan
Bachelor's Degree
Bachelor's Degree Comparison
Immigrants from Norway
Alaskan Athabascans
44.5%
BACHELOR'S DEGREE
99.9/ 100
METRIC RATING
49th/ 347
METRIC RANK
28.8%
BACHELOR'S DEGREE
0.0/ 100
METRIC RATING
321st/ 347
METRIC RANK
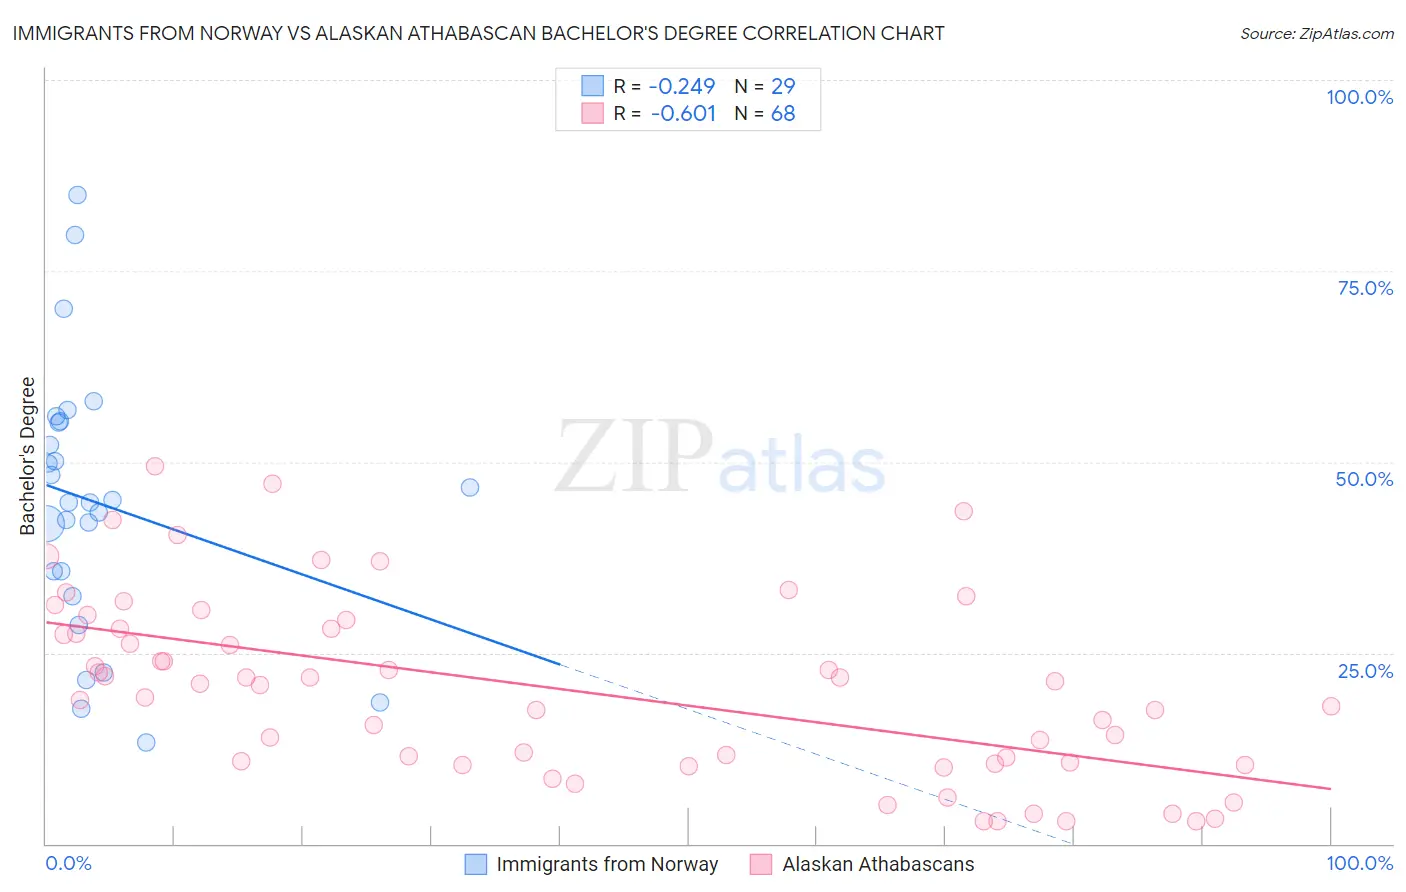
Immigrants from Norway vs Alaskan Athabascan Bachelor's Degree Correlation Chart
The statistical analysis conducted on geographies consisting of 116,713,560 people shows a weak negative correlation between the proportion of Immigrants from Norway and percentage of population with at least bachelor's degree education in the United States with a correlation coefficient (R) of -0.249 and weighted average of 44.5%. Similarly, the statistical analysis conducted on geographies consisting of 45,819,303 people shows a significant negative correlation between the proportion of Alaskan Athabascans and percentage of population with at least bachelor's degree education in the United States with a correlation coefficient (R) of -0.601 and weighted average of 28.8%, a difference of 54.4%.
Bachelor's Degree Correlation Summary
| Measurement | Immigrants from Norway | Alaskan Athabascan |
| Minimum | 13.2% | 2.9% |
| Maximum | 84.9% | 49.4% |
| Range | 71.7% | 46.5% |
| Mean | 44.6% | 20.3% |
| Median | 44.8% | 20.9% |
| Interquartile 25% (IQ1) | 34.0% | 10.6% |
| Interquartile 75% (IQ3) | 55.3% | 28.2% |
| Interquartile Range (IQR) | 21.2% | 17.6% |
| Standard Deviation (Sample) | 17.2% | 11.8% |
| Standard Deviation (Population) | 16.9% | 11.7% |
Similar Demographics by Bachelor's Degree
Demographics Similar to Immigrants from Norway by Bachelor's Degree
In terms of bachelor's degree, the demographic groups most similar to Immigrants from Norway are Bolivian (44.6%, a difference of 0.12%), Estonian (44.6%, a difference of 0.12%), Immigrants from Greece (44.5%, a difference of 0.12%), Immigrants from Bulgaria (44.6%, a difference of 0.16%), and Immigrants from Kuwait (44.6%, a difference of 0.22%).
| Demographics | Rating | Rank | Bachelor's Degree |
| Immigrants | Saudi Arabia | 100.0 /100 | #42 | Exceptional 44.8% |
| Immigrants | South Africa | 99.9 /100 | #43 | Exceptional 44.8% |
| Immigrants | Lithuania | 99.9 /100 | #44 | Exceptional 44.6% |
| Immigrants | Kuwait | 99.9 /100 | #45 | Exceptional 44.6% |
| Immigrants | Bulgaria | 99.9 /100 | #46 | Exceptional 44.6% |
| Bolivians | 99.9 /100 | #47 | Exceptional 44.6% |
| Estonians | 99.9 /100 | #48 | Exceptional 44.6% |
| Immigrants | Norway | 99.9 /100 | #49 | Exceptional 44.5% |
| Immigrants | Greece | 99.9 /100 | #50 | Exceptional 44.5% |
| Asians | 99.9 /100 | #51 | Exceptional 44.4% |
| Immigrants | Spain | 99.9 /100 | #52 | Exceptional 44.3% |
| Immigrants | Asia | 99.9 /100 | #53 | Exceptional 44.3% |
| Immigrants | Austria | 99.9 /100 | #54 | Exceptional 44.2% |
| Immigrants | Bolivia | 99.9 /100 | #55 | Exceptional 44.2% |
| Immigrants | Serbia | 99.9 /100 | #56 | Exceptional 44.1% |
Demographics Similar to Alaskan Athabascans by Bachelor's Degree
In terms of bachelor's degree, the demographic groups most similar to Alaskan Athabascans are Kiowa (28.8%, a difference of 0.080%), Creek (28.9%, a difference of 0.13%), Tsimshian (28.8%, a difference of 0.22%), Fijian (28.7%, a difference of 0.36%), and Yaqui (29.0%, a difference of 0.58%).
| Demographics | Rating | Rank | Bachelor's Degree |
| Shoshone | 0.0 /100 | #314 | Tragic 29.3% |
| Immigrants | Cabo Verde | 0.0 /100 | #315 | Tragic 29.2% |
| Sioux | 0.0 /100 | #316 | Tragic 29.1% |
| Colville | 0.0 /100 | #317 | Tragic 29.0% |
| Yaqui | 0.0 /100 | #318 | Tragic 29.0% |
| Creek | 0.0 /100 | #319 | Tragic 28.9% |
| Kiowa | 0.0 /100 | #320 | Tragic 28.8% |
| Alaskan Athabascans | 0.0 /100 | #321 | Tragic 28.8% |
| Tsimshian | 0.0 /100 | #322 | Tragic 28.8% |
| Fijians | 0.0 /100 | #323 | Tragic 28.7% |
| Dutch West Indians | 0.0 /100 | #324 | Tragic 28.5% |
| Pennsylvania Germans | 0.0 /100 | #325 | Tragic 28.4% |
| Apache | 0.0 /100 | #326 | Tragic 28.3% |
| Paiute | 0.0 /100 | #327 | Tragic 28.1% |
| Crow | 0.0 /100 | #328 | Tragic 27.7% |