Immigrants from Belgium vs Alaskan Athabascan Bachelor's Degree
COMPARE
Immigrants from Belgium
Alaskan Athabascan
Bachelor's Degree
Bachelor's Degree Comparison
Immigrants from Belgium
Alaskan Athabascans
47.0%
BACHELOR'S DEGREE
100.0/ 100
METRIC RATING
22nd/ 347
METRIC RANK
28.8%
BACHELOR'S DEGREE
0.0/ 100
METRIC RATING
321st/ 347
METRIC RANK
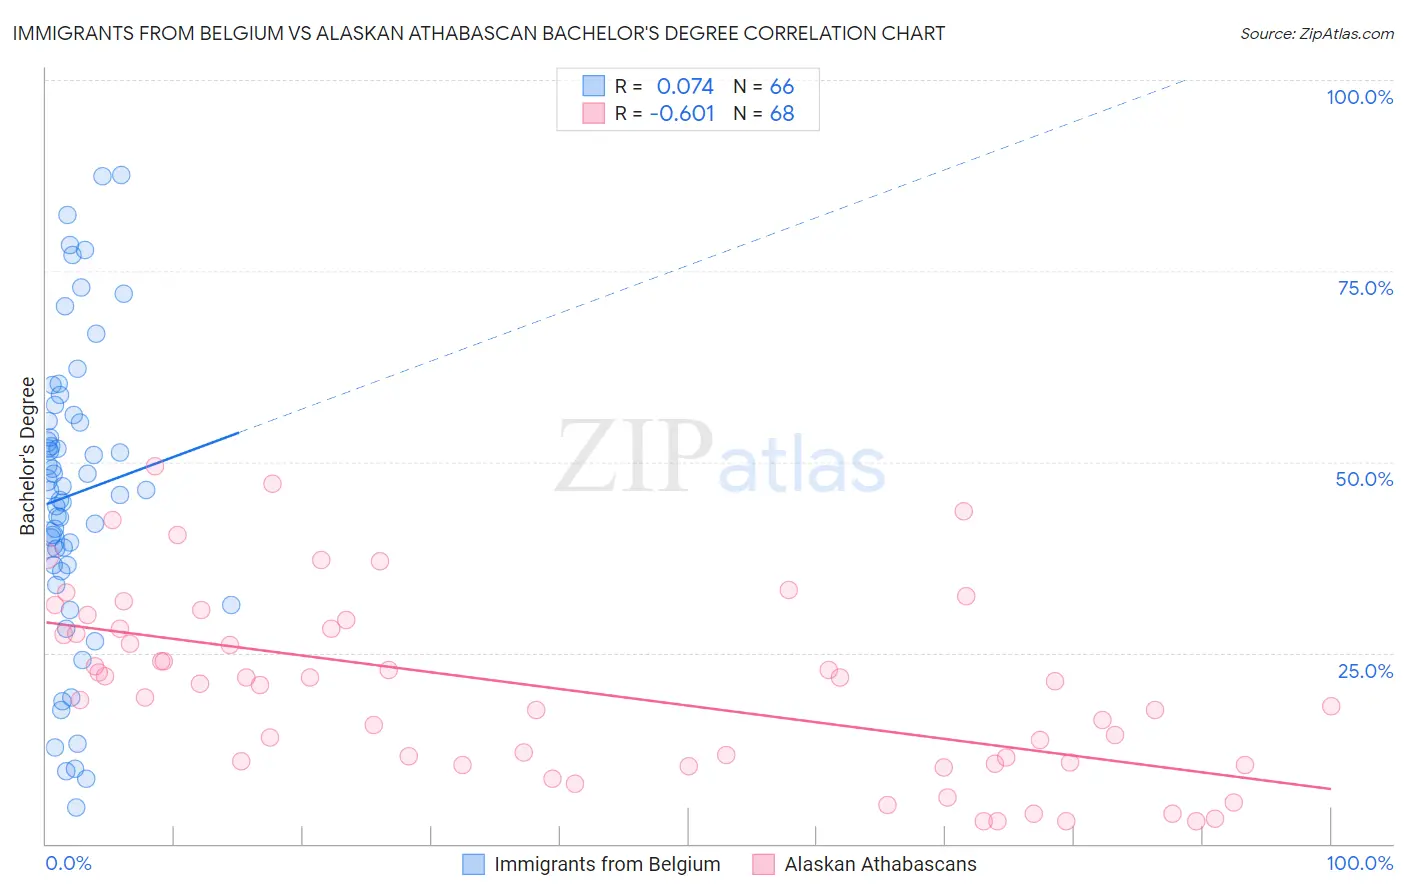
Immigrants from Belgium vs Alaskan Athabascan Bachelor's Degree Correlation Chart
The statistical analysis conducted on geographies consisting of 146,728,237 people shows a slight positive correlation between the proportion of Immigrants from Belgium and percentage of population with at least bachelor's degree education in the United States with a correlation coefficient (R) of 0.074 and weighted average of 47.0%. Similarly, the statistical analysis conducted on geographies consisting of 45,819,303 people shows a significant negative correlation between the proportion of Alaskan Athabascans and percentage of population with at least bachelor's degree education in the United States with a correlation coefficient (R) of -0.601 and weighted average of 28.8%, a difference of 63.2%.
Bachelor's Degree Correlation Summary
| Measurement | Immigrants from Belgium | Alaskan Athabascan |
| Minimum | 4.8% | 2.9% |
| Maximum | 87.6% | 49.4% |
| Range | 82.8% | 46.5% |
| Mean | 45.7% | 20.3% |
| Median | 46.3% | 20.9% |
| Interquartile 25% (IQ1) | 36.5% | 10.6% |
| Interquartile 75% (IQ3) | 55.4% | 28.2% |
| Interquartile Range (IQR) | 18.9% | 17.6% |
| Standard Deviation (Sample) | 19.4% | 11.8% |
| Standard Deviation (Population) | 19.2% | 11.7% |
Similar Demographics by Bachelor's Degree
Demographics Similar to Immigrants from Belgium by Bachelor's Degree
In terms of bachelor's degree, the demographic groups most similar to Immigrants from Belgium are Immigrants from Sweden (47.0%, a difference of 0.090%), Immigrants from Korea (47.0%, a difference of 0.13%), Immigrants from Ireland (47.1%, a difference of 0.20%), Immigrants from Switzerland (47.1%, a difference of 0.21%), and Burmese (46.9%, a difference of 0.35%).
| Demographics | Rating | Rank | Bachelor's Degree |
| Immigrants | Eastern Asia | 100.0 /100 | #15 | Exceptional 48.1% |
| Soviet Union | 100.0 /100 | #16 | Exceptional 47.9% |
| Eastern Europeans | 100.0 /100 | #17 | Exceptional 47.5% |
| Indians (Asian) | 100.0 /100 | #18 | Exceptional 47.4% |
| Cambodians | 100.0 /100 | #19 | Exceptional 47.2% |
| Immigrants | Switzerland | 100.0 /100 | #20 | Exceptional 47.1% |
| Immigrants | Ireland | 100.0 /100 | #21 | Exceptional 47.1% |
| Immigrants | Belgium | 100.0 /100 | #22 | Exceptional 47.0% |
| Immigrants | Sweden | 100.0 /100 | #23 | Exceptional 47.0% |
| Immigrants | Korea | 100.0 /100 | #24 | Exceptional 47.0% |
| Burmese | 100.0 /100 | #25 | Exceptional 46.9% |
| Immigrants | Japan | 100.0 /100 | #26 | Exceptional 46.8% |
| Immigrants | France | 100.0 /100 | #27 | Exceptional 46.4% |
| Turks | 100.0 /100 | #28 | Exceptional 46.2% |
| Israelis | 100.0 /100 | #29 | Exceptional 46.1% |
Demographics Similar to Alaskan Athabascans by Bachelor's Degree
In terms of bachelor's degree, the demographic groups most similar to Alaskan Athabascans are Kiowa (28.8%, a difference of 0.080%), Creek (28.9%, a difference of 0.13%), Tsimshian (28.8%, a difference of 0.22%), Fijian (28.7%, a difference of 0.36%), and Yaqui (29.0%, a difference of 0.58%).
| Demographics | Rating | Rank | Bachelor's Degree |
| Shoshone | 0.0 /100 | #314 | Tragic 29.3% |
| Immigrants | Cabo Verde | 0.0 /100 | #315 | Tragic 29.2% |
| Sioux | 0.0 /100 | #316 | Tragic 29.1% |
| Colville | 0.0 /100 | #317 | Tragic 29.0% |
| Yaqui | 0.0 /100 | #318 | Tragic 29.0% |
| Creek | 0.0 /100 | #319 | Tragic 28.9% |
| Kiowa | 0.0 /100 | #320 | Tragic 28.8% |
| Alaskan Athabascans | 0.0 /100 | #321 | Tragic 28.8% |
| Tsimshian | 0.0 /100 | #322 | Tragic 28.8% |
| Fijians | 0.0 /100 | #323 | Tragic 28.7% |
| Dutch West Indians | 0.0 /100 | #324 | Tragic 28.5% |
| Pennsylvania Germans | 0.0 /100 | #325 | Tragic 28.4% |
| Apache | 0.0 /100 | #326 | Tragic 28.3% |
| Paiute | 0.0 /100 | #327 | Tragic 28.1% |
| Crow | 0.0 /100 | #328 | Tragic 27.7% |