Immigrants from Uruguay vs Immigrants from Sierra Leone Associate's Degree
COMPARE
Immigrants from Uruguay
Immigrants from Sierra Leone
Associate's Degree
Associate's Degree Comparison
Immigrants from Uruguay
Immigrants from Sierra Leone
45.8%
ASSOCIATE'S DEGREE
35.5/ 100
METRIC RATING
187th/ 347
METRIC RANK
46.7%
ASSOCIATE'S DEGREE
59.2/ 100
METRIC RATING
167th/ 347
METRIC RANK
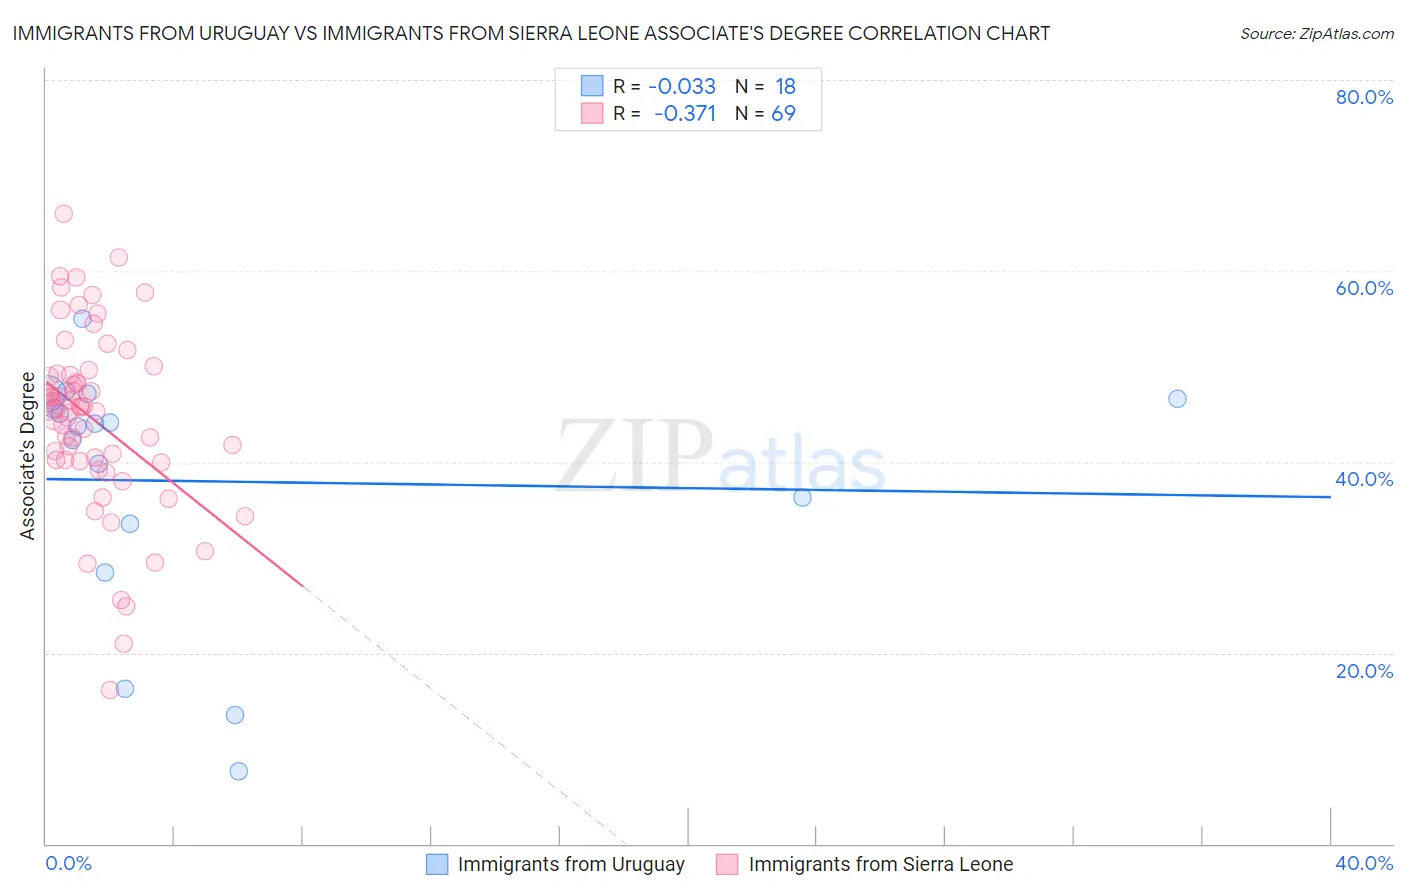
Immigrants from Uruguay vs Immigrants from Sierra Leone Associate's Degree Correlation Chart
The statistical analysis conducted on geographies consisting of 133,259,667 people shows no correlation between the proportion of Immigrants from Uruguay and percentage of population with at least associate's degree education in the United States with a correlation coefficient (R) of -0.033 and weighted average of 45.8%. Similarly, the statistical analysis conducted on geographies consisting of 101,624,736 people shows a mild negative correlation between the proportion of Immigrants from Sierra Leone and percentage of population with at least associate's degree education in the United States with a correlation coefficient (R) of -0.371 and weighted average of 46.7%, a difference of 1.8%.
Associate's Degree Correlation Summary
| Measurement | Immigrants from Uruguay | Immigrants from Sierra Leone |
| Minimum | 7.6% | 16.1% |
| Maximum | 55.0% | 66.0% |
| Range | 47.3% | 50.0% |
| Mean | 38.0% | 44.5% |
| Median | 43.9% | 45.7% |
| Interquartile 25% (IQ1) | 33.5% | 40.1% |
| Interquartile 75% (IQ3) | 46.6% | 49.2% |
| Interquartile Range (IQR) | 13.1% | 9.1% |
| Standard Deviation (Sample) | 13.2% | 9.5% |
| Standard Deviation (Population) | 12.8% | 9.4% |
Demographics Similar to Immigrants from Uruguay and Immigrants from Sierra Leone by Associate's Degree
In terms of associate's degree, the demographic groups most similar to Immigrants from Uruguay are Welsh (45.9%, a difference of 0.20%), Costa Rican (46.0%, a difference of 0.26%), Czechoslovakian (46.0%, a difference of 0.37%), Yugoslavian (46.0%, a difference of 0.38%), and Swiss (46.0%, a difference of 0.39%). Similarly, the demographic groups most similar to Immigrants from Sierra Leone are Immigrants from Somalia (46.5%, a difference of 0.29%), Uruguayan (46.5%, a difference of 0.29%), Irish (46.5%, a difference of 0.42%), Basque (46.5%, a difference of 0.48%), and Peruvian (46.4%, a difference of 0.66%).
| Demographics | Rating | Rank | Associate's Degree |
| Immigrants | Sierra Leone | 59.2 /100 | #167 | Average 46.7% |
| Immigrants | Somalia | 55.5 /100 | #168 | Average 46.5% |
| Uruguayans | 55.4 /100 | #169 | Average 46.5% |
| Irish | 53.6 /100 | #170 | Average 46.5% |
| Basques | 52.8 /100 | #171 | Average 46.5% |
| Peruvians | 50.5 /100 | #172 | Average 46.4% |
| Immigrants | Iraq | 50.3 /100 | #173 | Average 46.4% |
| English | 50.0 /100 | #174 | Average 46.4% |
| Belgians | 48.9 /100 | #175 | Average 46.3% |
| Finns | 48.5 /100 | #176 | Average 46.3% |
| Slovaks | 48.4 /100 | #177 | Average 46.3% |
| Immigrants | Bosnia and Herzegovina | 48.3 /100 | #178 | Average 46.3% |
| Sri Lankans | 47.6 /100 | #179 | Average 46.3% |
| Bermudans | 46.4 /100 | #180 | Average 46.2% |
| Immigrants | Colombia | 41.3 /100 | #181 | Average 46.0% |
| Swiss | 40.4 /100 | #182 | Average 46.0% |
| Yugoslavians | 40.2 /100 | #183 | Average 46.0% |
| Czechoslovakians | 40.0 /100 | #184 | Average 46.0% |
| Costa Ricans | 38.6 /100 | #185 | Fair 46.0% |
| Welsh | 37.9 /100 | #186 | Fair 45.9% |
| Immigrants | Uruguay | 35.5 /100 | #187 | Fair 45.8% |