Irish vs Yugoslavian High School Diploma
COMPARE
Irish
Yugoslavian
High School Diploma
High School Diploma Comparison
Irish
Yugoslavians
91.4%
HIGH SCHOOL DIPLOMA
99.9/ 100
METRIC RATING
35th/ 347
METRIC RANK
90.2%
HIGH SCHOOL DIPLOMA
96.2/ 100
METRIC RATING
114th/ 347
METRIC RANK
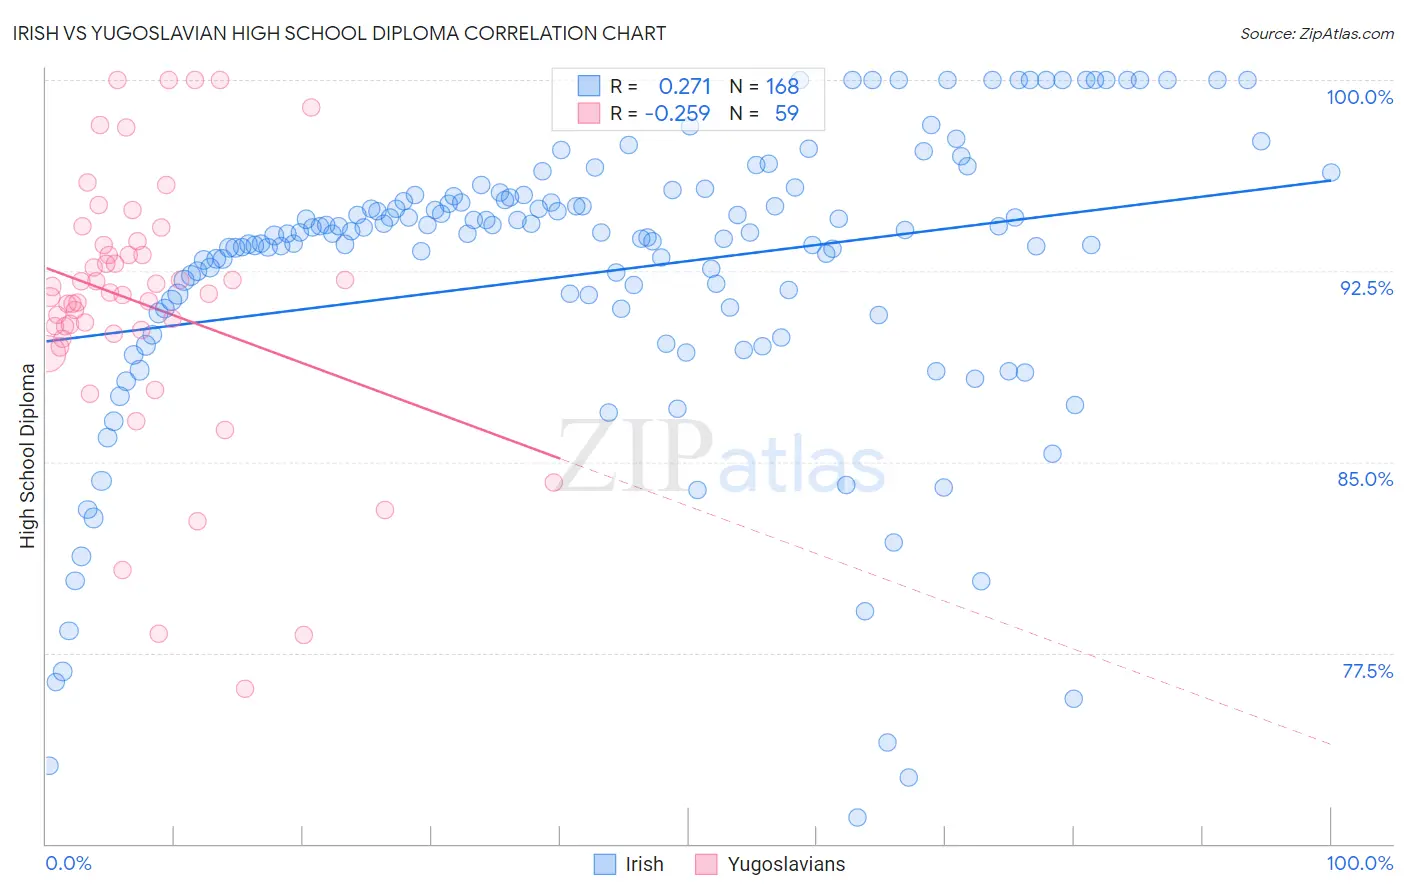
Irish vs Yugoslavian High School Diploma Correlation Chart
The statistical analysis conducted on geographies consisting of 580,709,825 people shows a weak positive correlation between the proportion of Irish and percentage of population with at least high school diploma education in the United States with a correlation coefficient (R) of 0.271 and weighted average of 91.4%. Similarly, the statistical analysis conducted on geographies consisting of 285,719,638 people shows a weak negative correlation between the proportion of Yugoslavians and percentage of population with at least high school diploma education in the United States with a correlation coefficient (R) of -0.259 and weighted average of 90.2%, a difference of 1.3%.
High School Diploma Correlation Summary
| Measurement | Irish | Yugoslavian |
| Minimum | 71.0% | 76.1% |
| Maximum | 100.0% | 100.0% |
| Range | 29.0% | 23.9% |
| Mean | 92.4% | 91.2% |
| Median | 94.0% | 91.6% |
| Interquartile 25% (IQ1) | 90.9% | 90.0% |
| Interquartile 75% (IQ3) | 95.3% | 93.5% |
| Interquartile Range (IQR) | 4.4% | 3.5% |
| Standard Deviation (Sample) | 5.9% | 5.2% |
| Standard Deviation (Population) | 5.9% | 5.1% |
Similar Demographics by High School Diploma
Demographics Similar to Irish by High School Diploma
In terms of high school diploma, the demographic groups most similar to Irish are Okinawan (91.4%, a difference of 0.030%), Scottish (91.4%, a difference of 0.030%), Tsimshian (91.3%, a difference of 0.030%), Immigrants from Northern Europe (91.4%, a difference of 0.040%), and English (91.4%, a difference of 0.040%).
| Demographics | Rating | Rank | High School Diploma |
| Tlingit-Haida | 99.9 /100 | #28 | Exceptional 91.4% |
| Europeans | 99.9 /100 | #29 | Exceptional 91.4% |
| Iranians | 99.9 /100 | #30 | Exceptional 91.4% |
| Immigrants | Northern Europe | 99.9 /100 | #31 | Exceptional 91.4% |
| English | 99.9 /100 | #32 | Exceptional 91.4% |
| Okinawans | 99.9 /100 | #33 | Exceptional 91.4% |
| Scottish | 99.9 /100 | #34 | Exceptional 91.4% |
| Irish | 99.9 /100 | #35 | Exceptional 91.4% |
| Tsimshian | 99.9 /100 | #36 | Exceptional 91.3% |
| Immigrants | Ireland | 99.9 /100 | #37 | Exceptional 91.3% |
| Immigrants | Scotland | 99.8 /100 | #38 | Exceptional 91.3% |
| Dutch | 99.8 /100 | #39 | Exceptional 91.3% |
| Immigrants | Lithuania | 99.8 /100 | #40 | Exceptional 91.3% |
| Immigrants | Australia | 99.8 /100 | #41 | Exceptional 91.3% |
| Northern Europeans | 99.8 /100 | #42 | Exceptional 91.3% |
Demographics Similar to Yugoslavians by High School Diploma
In terms of high school diploma, the demographic groups most similar to Yugoslavians are Immigrants from Sri Lanka (90.2%, a difference of 0.010%), Immigrants from Belarus (90.2%, a difference of 0.020%), Immigrants from Greece (90.3%, a difference of 0.040%), Menominee (90.3%, a difference of 0.040%), and Immigrants from Hungary (90.2%, a difference of 0.040%).
| Demographics | Rating | Rank | High School Diploma |
| Immigrants | Russia | 96.9 /100 | #107 | Exceptional 90.3% |
| Palestinians | 96.7 /100 | #108 | Exceptional 90.3% |
| Immigrants | Zimbabwe | 96.7 /100 | #109 | Exceptional 90.3% |
| Immigrants | Greece | 96.6 /100 | #110 | Exceptional 90.3% |
| Menominee | 96.6 /100 | #111 | Exceptional 90.3% |
| Immigrants | Belarus | 96.4 /100 | #112 | Exceptional 90.2% |
| Immigrants | Sri Lanka | 96.3 /100 | #113 | Exceptional 90.2% |
| Yugoslavians | 96.2 /100 | #114 | Exceptional 90.2% |
| Immigrants | Hungary | 95.8 /100 | #115 | Exceptional 90.2% |
| Immigrants | Germany | 95.7 /100 | #116 | Exceptional 90.2% |
| Jordanians | 95.4 /100 | #117 | Exceptional 90.2% |
| Israelis | 95.1 /100 | #118 | Exceptional 90.1% |
| Immigrants | Eastern Europe | 94.9 /100 | #119 | Exceptional 90.1% |
| Ottawa | 94.4 /100 | #120 | Exceptional 90.1% |
| Whites/Caucasians | 94.1 /100 | #121 | Exceptional 90.1% |