Irish vs Polish High School Diploma
COMPARE
Irish
Polish
High School Diploma
High School Diploma Comparison
Irish
Poles
91.4%
HIGH SCHOOL DIPLOMA
99.9/ 100
METRIC RATING
35th/ 347
METRIC RANK
91.9%
HIGH SCHOOL DIPLOMA
100.0/ 100
METRIC RATING
12th/ 347
METRIC RANK
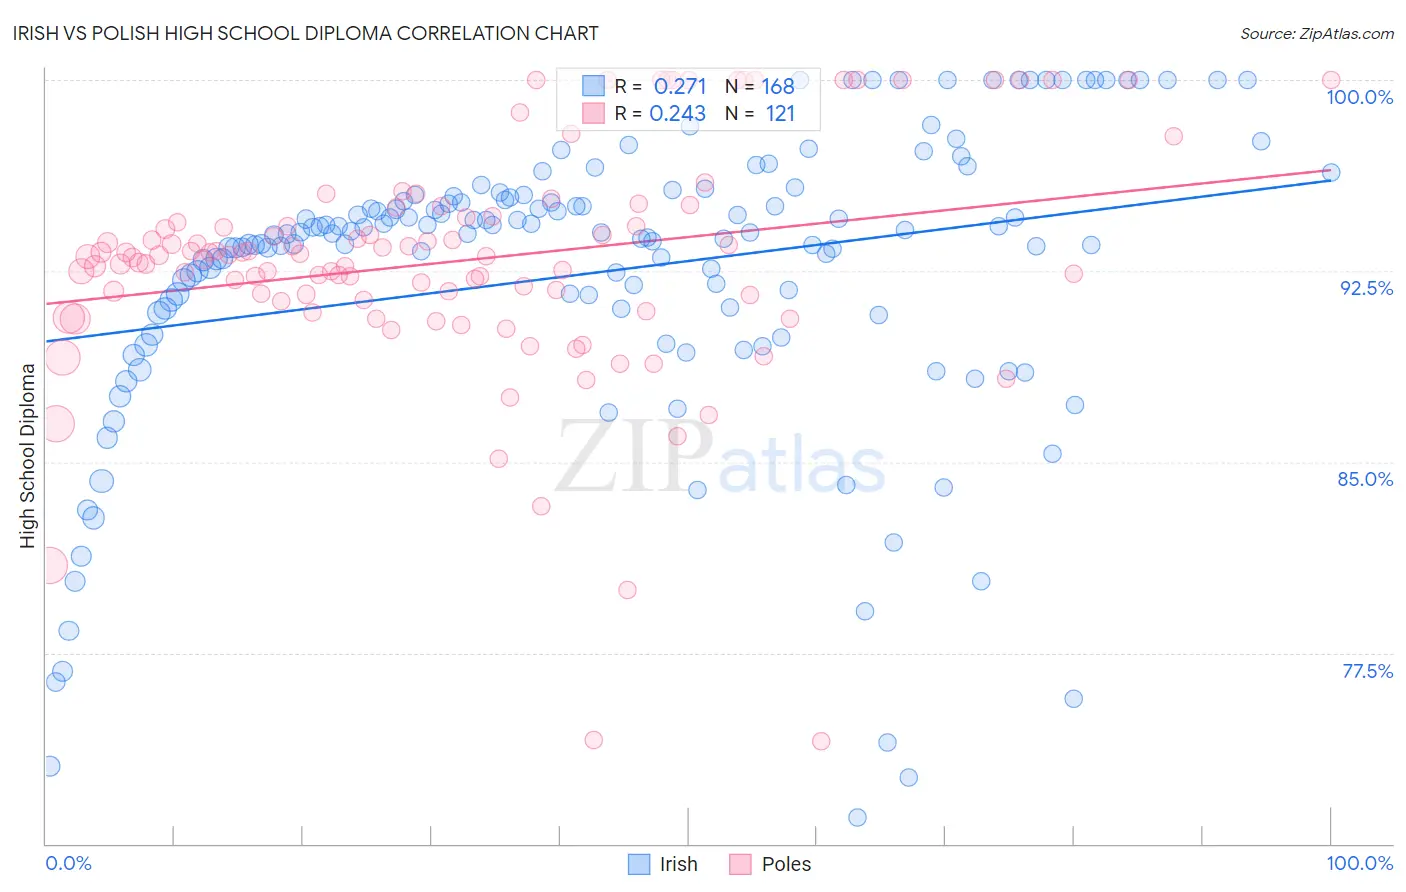
Irish vs Polish High School Diploma Correlation Chart
The statistical analysis conducted on geographies consisting of 580,709,825 people shows a weak positive correlation between the proportion of Irish and percentage of population with at least high school diploma education in the United States with a correlation coefficient (R) of 0.271 and weighted average of 91.4%. Similarly, the statistical analysis conducted on geographies consisting of 560,593,871 people shows a weak positive correlation between the proportion of Poles and percentage of population with at least high school diploma education in the United States with a correlation coefficient (R) of 0.243 and weighted average of 91.9%, a difference of 0.53%.
High School Diploma Correlation Summary
| Measurement | Irish | Polish |
| Minimum | 71.0% | 74.0% |
| Maximum | 100.0% | 100.0% |
| Range | 29.0% | 26.0% |
| Mean | 92.4% | 92.9% |
| Median | 94.0% | 93.1% |
| Interquartile 25% (IQ1) | 90.9% | 91.3% |
| Interquartile 75% (IQ3) | 95.3% | 94.6% |
| Interquartile Range (IQR) | 4.4% | 3.3% |
| Standard Deviation (Sample) | 5.9% | 4.6% |
| Standard Deviation (Population) | 5.9% | 4.6% |
Similar Demographics by High School Diploma
Demographics Similar to Irish by High School Diploma
In terms of high school diploma, the demographic groups most similar to Irish are Okinawan (91.4%, a difference of 0.030%), Scottish (91.4%, a difference of 0.030%), Tsimshian (91.3%, a difference of 0.030%), Immigrants from Northern Europe (91.4%, a difference of 0.040%), and English (91.4%, a difference of 0.040%).
| Demographics | Rating | Rank | High School Diploma |
| Tlingit-Haida | 99.9 /100 | #28 | Exceptional 91.4% |
| Europeans | 99.9 /100 | #29 | Exceptional 91.4% |
| Iranians | 99.9 /100 | #30 | Exceptional 91.4% |
| Immigrants | Northern Europe | 99.9 /100 | #31 | Exceptional 91.4% |
| English | 99.9 /100 | #32 | Exceptional 91.4% |
| Okinawans | 99.9 /100 | #33 | Exceptional 91.4% |
| Scottish | 99.9 /100 | #34 | Exceptional 91.4% |
| Irish | 99.9 /100 | #35 | Exceptional 91.4% |
| Tsimshian | 99.9 /100 | #36 | Exceptional 91.3% |
| Immigrants | Ireland | 99.9 /100 | #37 | Exceptional 91.3% |
| Immigrants | Scotland | 99.8 /100 | #38 | Exceptional 91.3% |
| Dutch | 99.8 /100 | #39 | Exceptional 91.3% |
| Immigrants | Lithuania | 99.8 /100 | #40 | Exceptional 91.3% |
| Immigrants | Australia | 99.8 /100 | #41 | Exceptional 91.3% |
| Northern Europeans | 99.8 /100 | #42 | Exceptional 91.3% |
Demographics Similar to Poles by High School Diploma
In terms of high school diploma, the demographic groups most similar to Poles are Eastern European (91.9%, a difference of 0.050%), Danish (91.8%, a difference of 0.050%), Bulgarian (91.8%, a difference of 0.10%), Croatian (92.0%, a difference of 0.11%), and Luxembourger (91.7%, a difference of 0.13%).
| Demographics | Rating | Rank | High School Diploma |
| Slovenes | 100.0 /100 | #5 | Exceptional 92.0% |
| Slovaks | 100.0 /100 | #6 | Exceptional 92.0% |
| Immigrants | India | 100.0 /100 | #7 | Exceptional 92.0% |
| Chinese | 100.0 /100 | #8 | Exceptional 92.0% |
| Latvians | 100.0 /100 | #9 | Exceptional 92.0% |
| Croatians | 100.0 /100 | #10 | Exceptional 92.0% |
| Eastern Europeans | 100.0 /100 | #11 | Exceptional 91.9% |
| Poles | 100.0 /100 | #12 | Exceptional 91.9% |
| Danes | 100.0 /100 | #13 | Exceptional 91.8% |
| Bulgarians | 100.0 /100 | #14 | Exceptional 91.8% |
| Luxembourgers | 100.0 /100 | #15 | Exceptional 91.7% |
| Finns | 100.0 /100 | #16 | Exceptional 91.7% |
| Immigrants | Singapore | 99.9 /100 | #17 | Exceptional 91.7% |
| Germans | 99.9 /100 | #18 | Exceptional 91.7% |
| Maltese | 99.9 /100 | #19 | Exceptional 91.6% |