Irish vs Japanese High School Diploma
COMPARE
Irish
Japanese
High School Diploma
High School Diploma Comparison
Irish
Japanese
91.4%
HIGH SCHOOL DIPLOMA
99.9/ 100
METRIC RATING
35th/ 347
METRIC RANK
85.9%
HIGH SCHOOL DIPLOMA
0.0/ 100
METRIC RATING
292nd/ 347
METRIC RANK
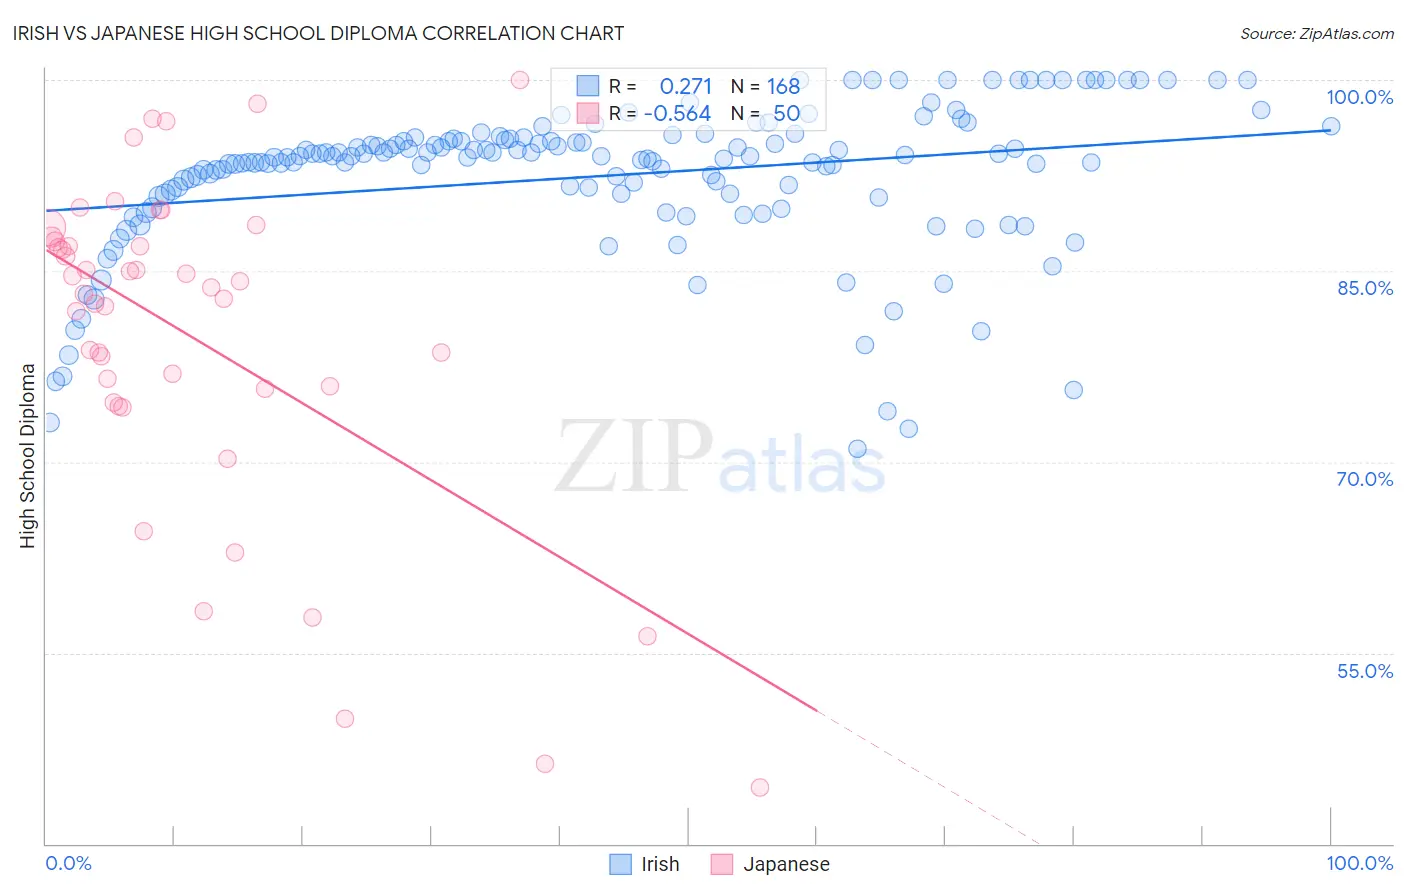
Irish vs Japanese High School Diploma Correlation Chart
The statistical analysis conducted on geographies consisting of 580,709,825 people shows a weak positive correlation between the proportion of Irish and percentage of population with at least high school diploma education in the United States with a correlation coefficient (R) of 0.271 and weighted average of 91.4%. Similarly, the statistical analysis conducted on geographies consisting of 249,183,224 people shows a substantial negative correlation between the proportion of Japanese and percentage of population with at least high school diploma education in the United States with a correlation coefficient (R) of -0.564 and weighted average of 85.9%, a difference of 6.4%.
High School Diploma Correlation Summary
| Measurement | Irish | Japanese |
| Minimum | 71.0% | 44.4% |
| Maximum | 100.0% | 100.0% |
| Range | 29.0% | 55.6% |
| Mean | 92.4% | 79.8% |
| Median | 94.0% | 83.4% |
| Interquartile 25% (IQ1) | 90.9% | 75.7% |
| Interquartile 75% (IQ3) | 95.3% | 87.3% |
| Interquartile Range (IQR) | 4.4% | 11.6% |
| Standard Deviation (Sample) | 5.9% | 13.0% |
| Standard Deviation (Population) | 5.9% | 12.8% |
Similar Demographics by High School Diploma
Demographics Similar to Irish by High School Diploma
In terms of high school diploma, the demographic groups most similar to Irish are Okinawan (91.4%, a difference of 0.030%), Scottish (91.4%, a difference of 0.030%), Tsimshian (91.3%, a difference of 0.030%), Immigrants from Northern Europe (91.4%, a difference of 0.040%), and English (91.4%, a difference of 0.040%).
| Demographics | Rating | Rank | High School Diploma |
| Tlingit-Haida | 99.9 /100 | #28 | Exceptional 91.4% |
| Europeans | 99.9 /100 | #29 | Exceptional 91.4% |
| Iranians | 99.9 /100 | #30 | Exceptional 91.4% |
| Immigrants | Northern Europe | 99.9 /100 | #31 | Exceptional 91.4% |
| English | 99.9 /100 | #32 | Exceptional 91.4% |
| Okinawans | 99.9 /100 | #33 | Exceptional 91.4% |
| Scottish | 99.9 /100 | #34 | Exceptional 91.4% |
| Irish | 99.9 /100 | #35 | Exceptional 91.4% |
| Tsimshian | 99.9 /100 | #36 | Exceptional 91.3% |
| Immigrants | Ireland | 99.9 /100 | #37 | Exceptional 91.3% |
| Immigrants | Scotland | 99.8 /100 | #38 | Exceptional 91.3% |
| Dutch | 99.8 /100 | #39 | Exceptional 91.3% |
| Immigrants | Lithuania | 99.8 /100 | #40 | Exceptional 91.3% |
| Immigrants | Australia | 99.8 /100 | #41 | Exceptional 91.3% |
| Northern Europeans | 99.8 /100 | #42 | Exceptional 91.3% |
Demographics Similar to Japanese by High School Diploma
In terms of high school diploma, the demographic groups most similar to Japanese are Haitian (85.9%, a difference of 0.0%), British West Indian (85.9%, a difference of 0.020%), Immigrants from Fiji (85.8%, a difference of 0.060%), Immigrants (85.8%, a difference of 0.070%), and Fijian (86.0%, a difference of 0.14%).
| Demographics | Rating | Rank | High School Diploma |
| Immigrants | West Indies | 0.0 /100 | #285 | Tragic 86.2% |
| Immigrants | St. Vincent and the Grenadines | 0.0 /100 | #286 | Tragic 86.2% |
| Ute | 0.0 /100 | #287 | Tragic 86.2% |
| Immigrants | Vietnam | 0.0 /100 | #288 | Tragic 86.2% |
| Yup'ik | 0.0 /100 | #289 | Tragic 86.1% |
| Fijians | 0.0 /100 | #290 | Tragic 86.0% |
| Haitians | 0.0 /100 | #291 | Tragic 85.9% |
| Japanese | 0.0 /100 | #292 | Tragic 85.9% |
| British West Indians | 0.0 /100 | #293 | Tragic 85.9% |
| Immigrants | Fiji | 0.0 /100 | #294 | Tragic 85.8% |
| Immigrants | Immigrants | 0.0 /100 | #295 | Tragic 85.8% |
| Immigrants | Cambodia | 0.0 /100 | #296 | Tragic 85.6% |
| Immigrants | Grenada | 0.0 /100 | #297 | Tragic 85.6% |
| Natives/Alaskans | 0.0 /100 | #298 | Tragic 85.6% |
| Guyanese | 0.0 /100 | #299 | Tragic 85.5% |