Guamanian/Chamorro vs Yugoslavian High School Diploma
COMPARE
Guamanian/Chamorro
Yugoslavian
High School Diploma
High School Diploma Comparison
Guamanians/Chamorros
Yugoslavians
88.9%
HIGH SCHOOL DIPLOMA
35.5/ 100
METRIC RATING
187th/ 347
METRIC RANK
90.2%
HIGH SCHOOL DIPLOMA
96.2/ 100
METRIC RATING
114th/ 347
METRIC RANK
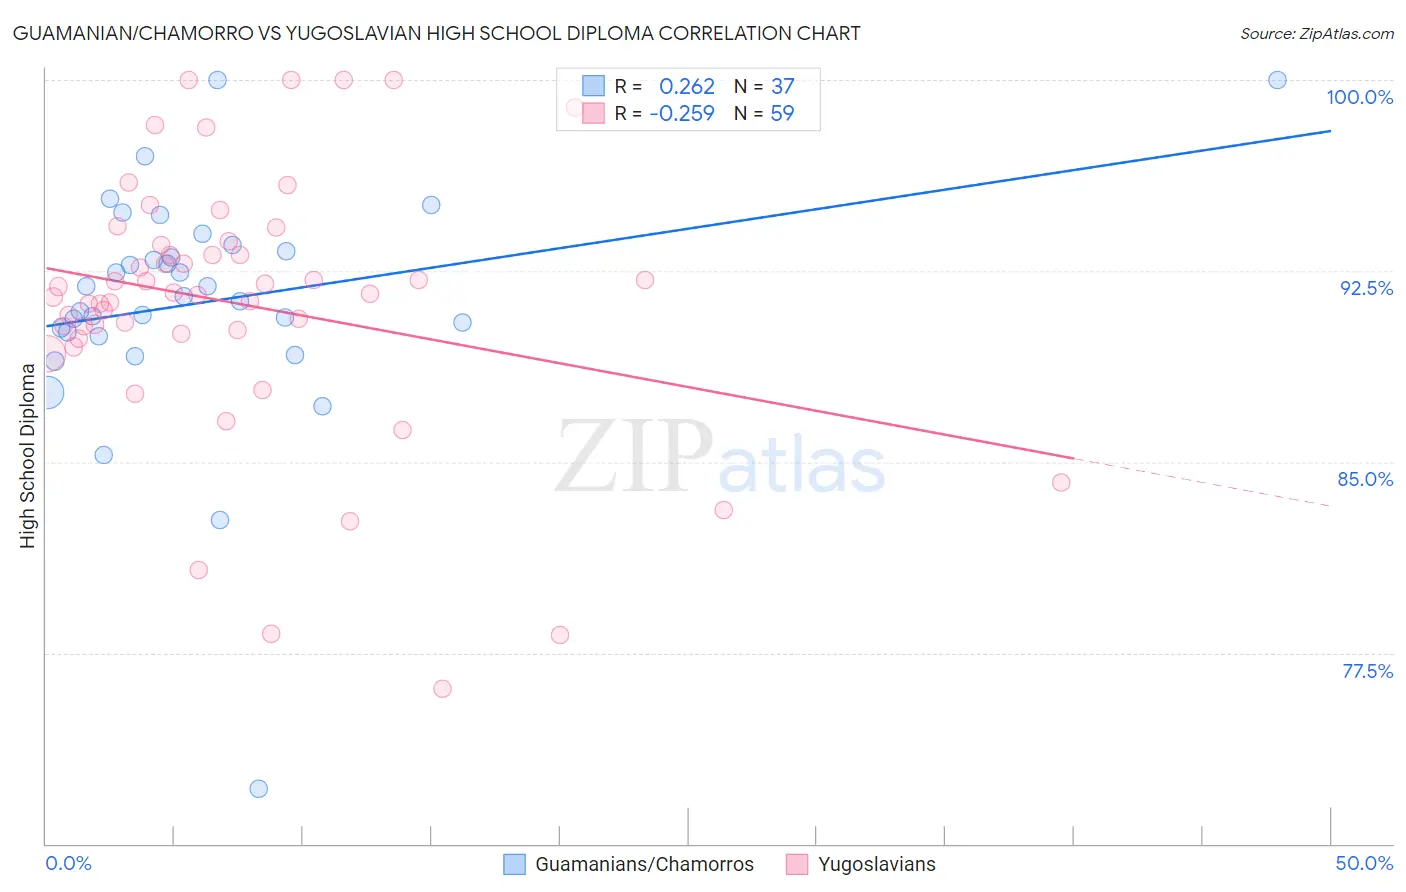
Guamanian/Chamorro vs Yugoslavian High School Diploma Correlation Chart
The statistical analysis conducted on geographies consisting of 221,965,618 people shows a weak positive correlation between the proportion of Guamanians/Chamorros and percentage of population with at least high school diploma education in the United States with a correlation coefficient (R) of 0.262 and weighted average of 88.9%. Similarly, the statistical analysis conducted on geographies consisting of 285,719,638 people shows a weak negative correlation between the proportion of Yugoslavians and percentage of population with at least high school diploma education in the United States with a correlation coefficient (R) of -0.259 and weighted average of 90.2%, a difference of 1.5%.
High School Diploma Correlation Summary
| Measurement | Guamanian/Chamorro | Yugoslavian |
| Minimum | 72.2% | 76.1% |
| Maximum | 100.0% | 100.0% |
| Range | 27.8% | 23.9% |
| Mean | 91.3% | 91.2% |
| Median | 91.5% | 91.6% |
| Interquartile 25% (IQ1) | 90.0% | 90.0% |
| Interquartile 75% (IQ3) | 93.4% | 93.5% |
| Interquartile Range (IQR) | 3.4% | 3.5% |
| Standard Deviation (Sample) | 4.7% | 5.2% |
| Standard Deviation (Population) | 4.6% | 5.1% |
Similar Demographics by High School Diploma
Demographics Similar to Guamanians/Chamorros by High School Diploma
In terms of high school diploma, the demographic groups most similar to Guamanians/Chamorros are Immigrants from Eastern Africa (88.9%, a difference of 0.0%), Ethiopian (89.0%, a difference of 0.020%), Immigrants from Sudan (88.9%, a difference of 0.040%), Immigrants from Uganda (88.9%, a difference of 0.050%), and Immigrants from Syria (89.0%, a difference of 0.060%).
| Demographics | Rating | Rank | High School Diploma |
| Bolivians | 45.2 /100 | #180 | Average 89.1% |
| Venezuelans | 43.6 /100 | #181 | Average 89.1% |
| Spaniards | 43.4 /100 | #182 | Average 89.1% |
| Potawatomi | 42.5 /100 | #183 | Average 89.0% |
| Immigrants | Syria | 39.2 /100 | #184 | Fair 89.0% |
| Ethiopians | 37.0 /100 | #185 | Fair 89.0% |
| Immigrants | Eastern Africa | 35.8 /100 | #186 | Fair 88.9% |
| Guamanians/Chamorros | 35.5 /100 | #187 | Fair 88.9% |
| Immigrants | Sudan | 33.4 /100 | #188 | Fair 88.9% |
| Immigrants | Uganda | 32.6 /100 | #189 | Fair 88.9% |
| Immigrants | Chile | 31.9 /100 | #190 | Fair 88.9% |
| Immigrants | Ethiopia | 30.9 /100 | #191 | Fair 88.9% |
| Moroccans | 29.5 /100 | #192 | Fair 88.8% |
| Immigrants | Oceania | 26.9 /100 | #193 | Fair 88.8% |
| Immigrants | Venezuela | 25.8 /100 | #194 | Fair 88.8% |
Demographics Similar to Yugoslavians by High School Diploma
In terms of high school diploma, the demographic groups most similar to Yugoslavians are Immigrants from Sri Lanka (90.2%, a difference of 0.010%), Immigrants from Belarus (90.2%, a difference of 0.020%), Immigrants from Greece (90.3%, a difference of 0.040%), Menominee (90.3%, a difference of 0.040%), and Immigrants from Hungary (90.2%, a difference of 0.040%).
| Demographics | Rating | Rank | High School Diploma |
| Immigrants | Russia | 96.9 /100 | #107 | Exceptional 90.3% |
| Palestinians | 96.7 /100 | #108 | Exceptional 90.3% |
| Immigrants | Zimbabwe | 96.7 /100 | #109 | Exceptional 90.3% |
| Immigrants | Greece | 96.6 /100 | #110 | Exceptional 90.3% |
| Menominee | 96.6 /100 | #111 | Exceptional 90.3% |
| Immigrants | Belarus | 96.4 /100 | #112 | Exceptional 90.2% |
| Immigrants | Sri Lanka | 96.3 /100 | #113 | Exceptional 90.2% |
| Yugoslavians | 96.2 /100 | #114 | Exceptional 90.2% |
| Immigrants | Hungary | 95.8 /100 | #115 | Exceptional 90.2% |
| Immigrants | Germany | 95.7 /100 | #116 | Exceptional 90.2% |
| Jordanians | 95.4 /100 | #117 | Exceptional 90.2% |
| Israelis | 95.1 /100 | #118 | Exceptional 90.1% |
| Immigrants | Eastern Europe | 94.9 /100 | #119 | Exceptional 90.1% |
| Ottawa | 94.4 /100 | #120 | Exceptional 90.1% |
| Whites/Caucasians | 94.1 /100 | #121 | Exceptional 90.1% |