Irish vs Immigrants from Canada High School Diploma
COMPARE
Irish
Immigrants from Canada
High School Diploma
High School Diploma Comparison
Irish
Immigrants from Canada
91.4%
HIGH SCHOOL DIPLOMA
99.9/ 100
METRIC RATING
35th/ 347
METRIC RANK
91.1%
HIGH SCHOOL DIPLOMA
99.7/ 100
METRIC RATING
56th/ 347
METRIC RANK
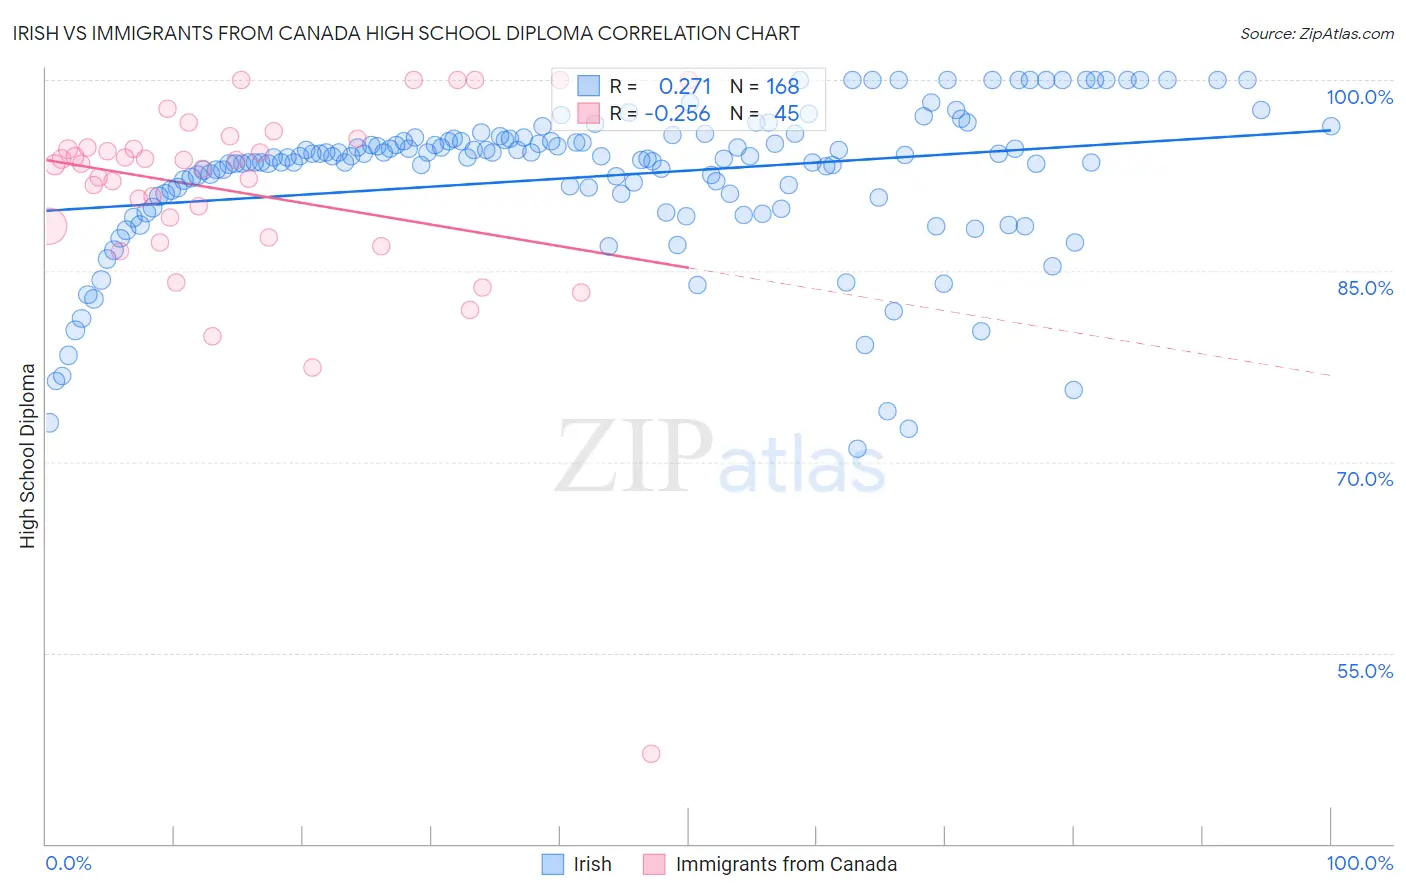
Irish vs Immigrants from Canada High School Diploma Correlation Chart
The statistical analysis conducted on geographies consisting of 580,709,825 people shows a weak positive correlation between the proportion of Irish and percentage of population with at least high school diploma education in the United States with a correlation coefficient (R) of 0.271 and weighted average of 91.4%. Similarly, the statistical analysis conducted on geographies consisting of 459,397,064 people shows a weak negative correlation between the proportion of Immigrants from Canada and percentage of population with at least high school diploma education in the United States with a correlation coefficient (R) of -0.256 and weighted average of 91.1%, a difference of 0.33%.
High School Diploma Correlation Summary
| Measurement | Irish | Immigrants from Canada |
| Minimum | 71.0% | 47.1% |
| Maximum | 100.0% | 100.0% |
| Range | 29.0% | 52.9% |
| Mean | 92.4% | 91.1% |
| Median | 94.0% | 93.4% |
| Interquartile 25% (IQ1) | 90.9% | 88.1% |
| Interquartile 75% (IQ3) | 95.3% | 95.1% |
| Interquartile Range (IQR) | 4.4% | 7.0% |
| Standard Deviation (Sample) | 5.9% | 8.7% |
| Standard Deviation (Population) | 5.9% | 8.6% |
Similar Demographics by High School Diploma
Demographics Similar to Irish by High School Diploma
In terms of high school diploma, the demographic groups most similar to Irish are Okinawan (91.4%, a difference of 0.030%), Scottish (91.4%, a difference of 0.030%), Tsimshian (91.3%, a difference of 0.030%), Immigrants from Northern Europe (91.4%, a difference of 0.040%), and English (91.4%, a difference of 0.040%).
| Demographics | Rating | Rank | High School Diploma |
| Tlingit-Haida | 99.9 /100 | #28 | Exceptional 91.4% |
| Europeans | 99.9 /100 | #29 | Exceptional 91.4% |
| Iranians | 99.9 /100 | #30 | Exceptional 91.4% |
| Immigrants | Northern Europe | 99.9 /100 | #31 | Exceptional 91.4% |
| English | 99.9 /100 | #32 | Exceptional 91.4% |
| Okinawans | 99.9 /100 | #33 | Exceptional 91.4% |
| Scottish | 99.9 /100 | #34 | Exceptional 91.4% |
| Irish | 99.9 /100 | #35 | Exceptional 91.4% |
| Tsimshian | 99.9 /100 | #36 | Exceptional 91.3% |
| Immigrants | Ireland | 99.9 /100 | #37 | Exceptional 91.3% |
| Immigrants | Scotland | 99.8 /100 | #38 | Exceptional 91.3% |
| Dutch | 99.8 /100 | #39 | Exceptional 91.3% |
| Immigrants | Lithuania | 99.8 /100 | #40 | Exceptional 91.3% |
| Immigrants | Australia | 99.8 /100 | #41 | Exceptional 91.3% |
| Northern Europeans | 99.8 /100 | #42 | Exceptional 91.3% |
Demographics Similar to Immigrants from Canada by High School Diploma
In terms of high school diploma, the demographic groups most similar to Immigrants from Canada are Zimbabwean (91.1%, a difference of 0.020%), Serbian (91.1%, a difference of 0.030%), Slavic (91.0%, a difference of 0.030%), Immigrants from North America (91.0%, a difference of 0.030%), and Macedonian (91.1%, a difference of 0.040%).
| Demographics | Rating | Rank | High School Diploma |
| Bhutanese | 99.8 /100 | #49 | Exceptional 91.2% |
| Welsh | 99.8 /100 | #50 | Exceptional 91.2% |
| New Zealanders | 99.7 /100 | #51 | Exceptional 91.1% |
| Immigrants | Sweden | 99.7 /100 | #52 | Exceptional 91.1% |
| Immigrants | Belgium | 99.7 /100 | #53 | Exceptional 91.1% |
| Macedonians | 99.7 /100 | #54 | Exceptional 91.1% |
| Serbians | 99.7 /100 | #55 | Exceptional 91.1% |
| Immigrants | Canada | 99.7 /100 | #56 | Exceptional 91.1% |
| Zimbabweans | 99.7 /100 | #57 | Exceptional 91.1% |
| Slavs | 99.7 /100 | #58 | Exceptional 91.0% |
| Immigrants | North America | 99.7 /100 | #59 | Exceptional 91.0% |
| Immigrants | Japan | 99.6 /100 | #60 | Exceptional 91.0% |
| Immigrants | Taiwan | 99.6 /100 | #61 | Exceptional 91.0% |
| Austrians | 99.6 /100 | #62 | Exceptional 91.0% |
| Immigrants | Netherlands | 99.6 /100 | #63 | Exceptional 91.0% |