Immigrants from Ukraine vs Immigrants from Switzerland High School Diploma
COMPARE
Immigrants from Ukraine
Immigrants from Switzerland
High School Diploma
High School Diploma Comparison
Immigrants from Ukraine
Immigrants from Switzerland
89.8%
HIGH SCHOOL DIPLOMA
87.9/ 100
METRIC RATING
130th/ 347
METRIC RANK
90.8%
HIGH SCHOOL DIPLOMA
99.3/ 100
METRIC RATING
81st/ 347
METRIC RANK
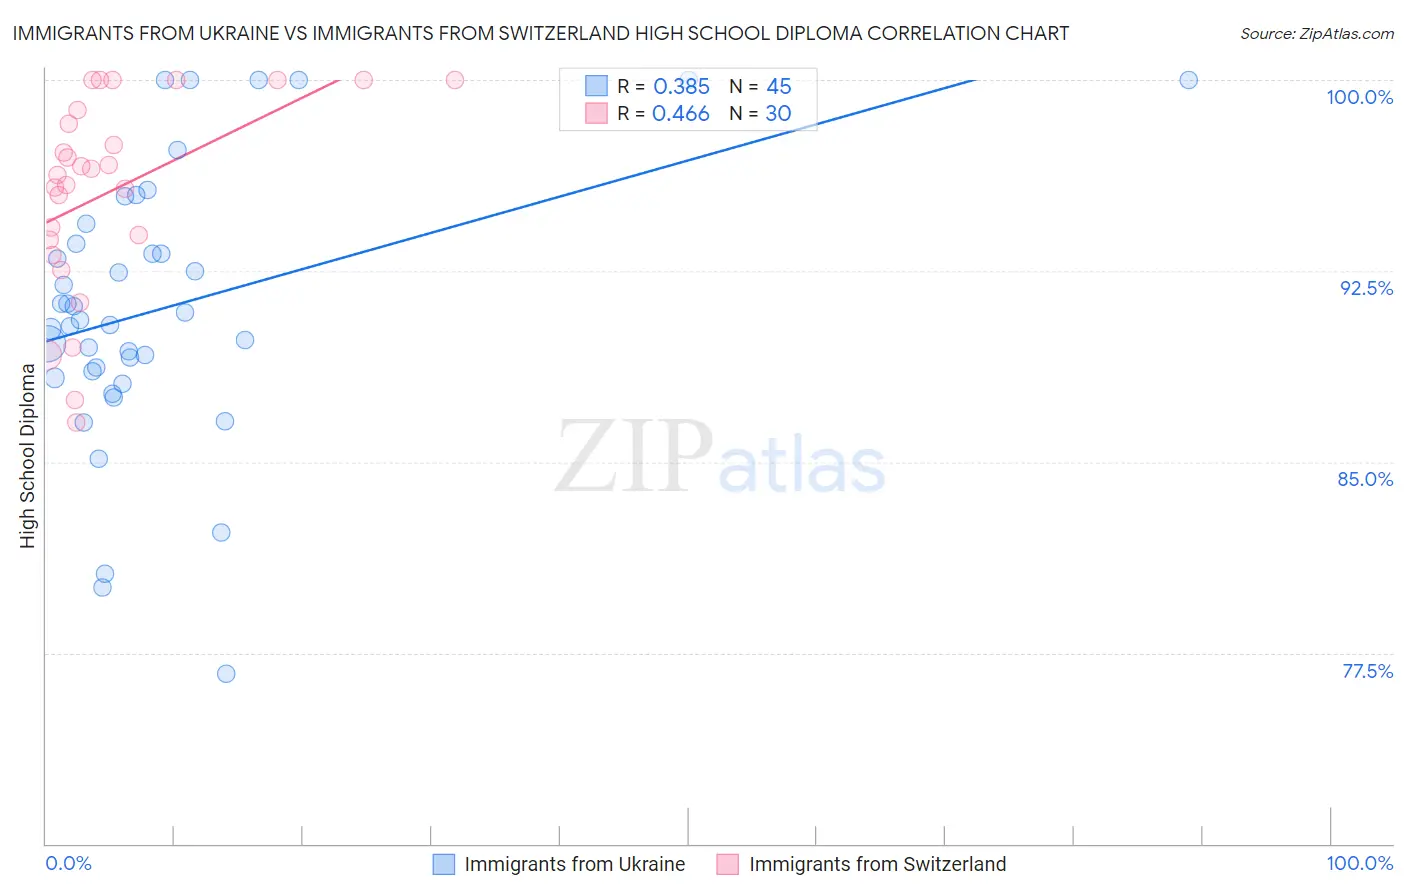
Immigrants from Ukraine vs Immigrants from Switzerland High School Diploma Correlation Chart
The statistical analysis conducted on geographies consisting of 289,714,613 people shows a mild positive correlation between the proportion of Immigrants from Ukraine and percentage of population with at least high school diploma education in the United States with a correlation coefficient (R) of 0.385 and weighted average of 89.8%. Similarly, the statistical analysis conducted on geographies consisting of 148,083,583 people shows a moderate positive correlation between the proportion of Immigrants from Switzerland and percentage of population with at least high school diploma education in the United States with a correlation coefficient (R) of 0.466 and weighted average of 90.8%, a difference of 1.1%.
High School Diploma Correlation Summary
| Measurement | Immigrants from Ukraine | Immigrants from Switzerland |
| Minimum | 76.7% | 86.5% |
| Maximum | 100.0% | 100.0% |
| Range | 23.3% | 13.5% |
| Mean | 91.0% | 95.6% |
| Median | 90.6% | 96.4% |
| Interquartile 25% (IQ1) | 88.4% | 93.7% |
| Interquartile 75% (IQ3) | 94.0% | 98.8% |
| Interquartile Range (IQR) | 5.5% | 5.1% |
| Standard Deviation (Sample) | 5.4% | 3.9% |
| Standard Deviation (Population) | 5.3% | 3.8% |
Similar Demographics by High School Diploma
Demographics Similar to Immigrants from Ukraine by High School Diploma
In terms of high school diploma, the demographic groups most similar to Immigrants from Ukraine are Basque (89.8%, a difference of 0.020%), Immigrants from Italy (89.8%, a difference of 0.020%), Immigrants from Bosnia and Herzegovina (89.8%, a difference of 0.020%), Albanian (89.8%, a difference of 0.020%), and Immigrants from Jordan (89.8%, a difference of 0.020%).
| Demographics | Rating | Rank | High School Diploma |
| German Russians | 92.0 /100 | #123 | Exceptional 90.0% |
| Mongolians | 91.6 /100 | #124 | Exceptional 89.9% |
| Egyptians | 91.1 /100 | #125 | Exceptional 89.9% |
| Alaska Natives | 91.0 /100 | #126 | Exceptional 89.9% |
| Immigrants | Eastern Asia | 89.2 /100 | #127 | Excellent 89.9% |
| Puget Sound Salish | 89.1 /100 | #128 | Excellent 89.9% |
| Basques | 88.5 /100 | #129 | Excellent 89.8% |
| Immigrants | Ukraine | 87.9 /100 | #130 | Excellent 89.8% |
| Immigrants | Italy | 87.4 /100 | #131 | Excellent 89.8% |
| Immigrants | Bosnia and Herzegovina | 87.3 /100 | #132 | Excellent 89.8% |
| Albanians | 87.2 /100 | #133 | Excellent 89.8% |
| Immigrants | Jordan | 87.2 /100 | #134 | Excellent 89.8% |
| Chippewa | 85.6 /100 | #135 | Excellent 89.7% |
| Ugandans | 83.7 /100 | #136 | Excellent 89.7% |
| Arabs | 83.6 /100 | #137 | Excellent 89.7% |
Demographics Similar to Immigrants from Switzerland by High School Diploma
In terms of high school diploma, the demographic groups most similar to Immigrants from Switzerland are Immigrants from England (90.8%, a difference of 0.0%), Immigrants from Denmark (90.8%, a difference of 0.010%), Native Hawaiian (90.8%, a difference of 0.020%), Burmese (90.8%, a difference of 0.020%), and Hungarian (90.8%, a difference of 0.030%).
| Demographics | Rating | Rank | High School Diploma |
| Immigrants | Czechoslovakia | 99.4 /100 | #74 | Exceptional 90.9% |
| Cambodians | 99.4 /100 | #75 | Exceptional 90.8% |
| Hungarians | 99.3 /100 | #76 | Exceptional 90.8% |
| Native Hawaiians | 99.3 /100 | #77 | Exceptional 90.8% |
| Burmese | 99.3 /100 | #78 | Exceptional 90.8% |
| Immigrants | Denmark | 99.3 /100 | #79 | Exceptional 90.8% |
| Immigrants | England | 99.3 /100 | #80 | Exceptional 90.8% |
| Immigrants | Switzerland | 99.3 /100 | #81 | Exceptional 90.8% |
| Scotch-Irish | 99.2 /100 | #82 | Exceptional 90.8% |
| Immigrants | Moldova | 99.2 /100 | #83 | Exceptional 90.7% |
| Immigrants | Saudi Arabia | 99.1 /100 | #84 | Exceptional 90.7% |
| Romanians | 98.9 /100 | #85 | Exceptional 90.7% |
| Immigrants | Bulgaria | 98.9 /100 | #86 | Exceptional 90.6% |
| Immigrants | Turkey | 98.9 /100 | #87 | Exceptional 90.6% |
| Immigrants | France | 98.8 /100 | #88 | Exceptional 90.6% |