Irish vs Immigrants from Armenia Professional Degree
COMPARE
Irish
Immigrants from Armenia
Professional Degree
Professional Degree Comparison
Irish
Immigrants from Armenia
4.4%
PROFESSIONAL DEGREE
50.0/ 100
METRIC RATING
175th/ 347
METRIC RANK
4.5%
PROFESSIONAL DEGREE
68.8/ 100
METRIC RATING
158th/ 347
METRIC RANK
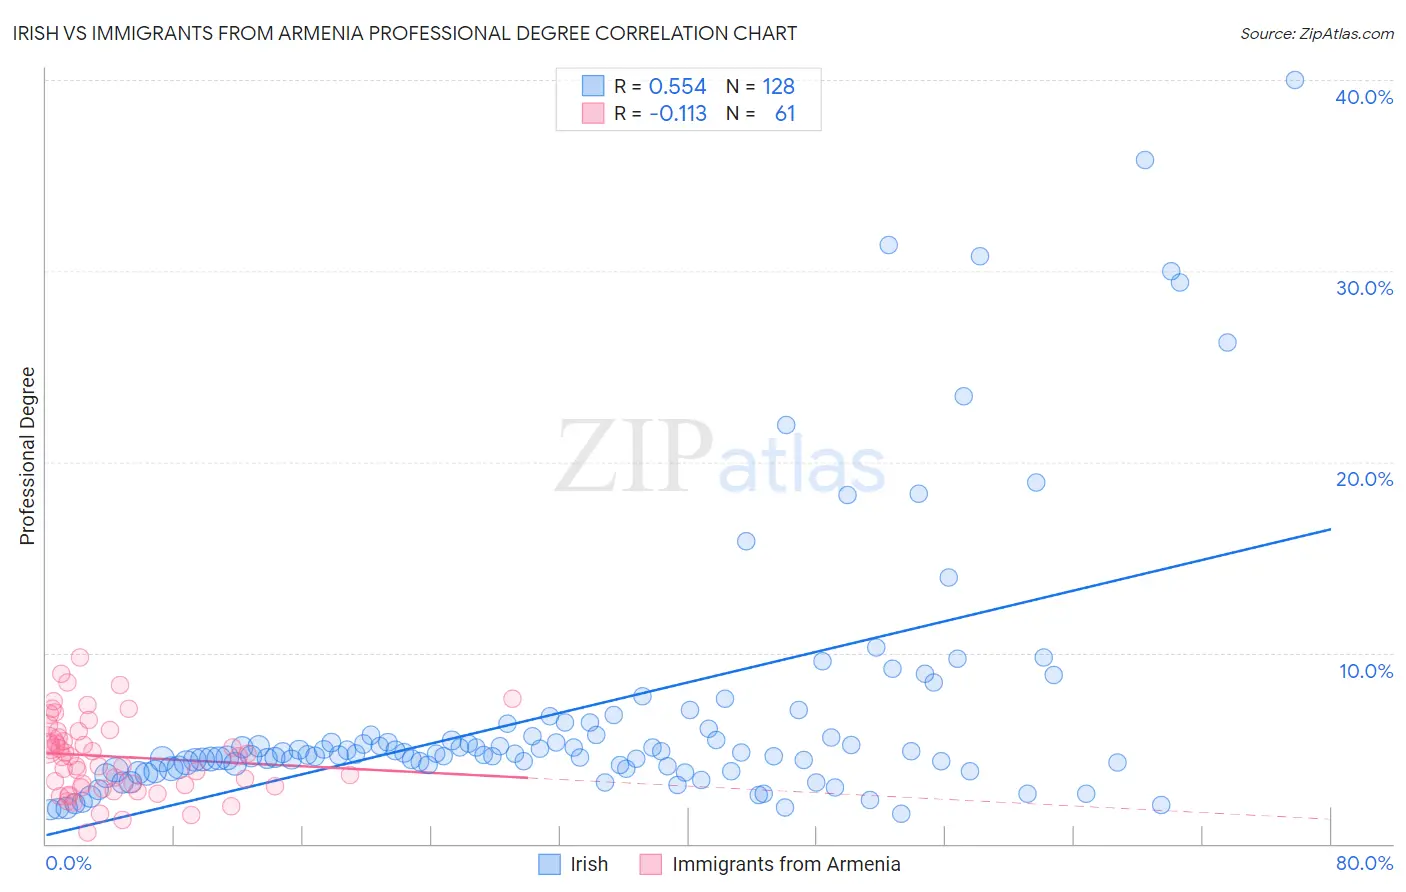
Irish vs Immigrants from Armenia Professional Degree Correlation Chart
The statistical analysis conducted on geographies consisting of 569,237,980 people shows a substantial positive correlation between the proportion of Irish and percentage of population with at least professional degree education in the United States with a correlation coefficient (R) of 0.554 and weighted average of 4.4%. Similarly, the statistical analysis conducted on geographies consisting of 97,675,844 people shows a poor negative correlation between the proportion of Immigrants from Armenia and percentage of population with at least professional degree education in the United States with a correlation coefficient (R) of -0.113 and weighted average of 4.5%, a difference of 2.9%.
Professional Degree Correlation Summary
| Measurement | Irish | Immigrants from Armenia |
| Minimum | 1.5% | 0.57% |
| Maximum | 40.0% | 9.8% |
| Range | 38.5% | 9.2% |
| Mean | 7.0% | 4.6% |
| Median | 4.7% | 4.6% |
| Interquartile 25% (IQ1) | 4.0% | 3.0% |
| Interquartile 75% (IQ3) | 5.9% | 5.9% |
| Interquartile Range (IQR) | 1.9% | 2.9% |
| Standard Deviation (Sample) | 7.1% | 2.0% |
| Standard Deviation (Population) | 7.1% | 2.0% |
Demographics Similar to Irish and Immigrants from Armenia by Professional Degree
In terms of professional degree, the demographic groups most similar to Irish are Kenyan (4.4%, a difference of 0.0%), English (4.4%, a difference of 0.020%), Immigrants from Peru (4.4%, a difference of 0.10%), Spaniard (4.4%, a difference of 0.30%), and Immigrants from Bangladesh (4.4%, a difference of 0.87%). Similarly, the demographic groups most similar to Immigrants from Armenia are Vietnamese (4.5%, a difference of 0.080%), Immigrants from Senegal (4.5%, a difference of 0.14%), Iraqi (4.5%, a difference of 0.17%), Swedish (4.5%, a difference of 0.18%), and Assyrian/Chaldean/Syriac (4.5%, a difference of 0.24%).
| Demographics | Rating | Rank | Professional Degree |
| Swedes | 69.9 /100 | #156 | Good 4.5% |
| Iraqis | 69.8 /100 | #157 | Good 4.5% |
| Immigrants | Armenia | 68.8 /100 | #158 | Good 4.5% |
| Vietnamese | 68.4 /100 | #159 | Good 4.5% |
| Immigrants | Senegal | 68.0 /100 | #160 | Good 4.5% |
| Assyrians/Chaldeans/Syriacs | 67.4 /100 | #161 | Good 4.5% |
| Peruvians | 65.2 /100 | #162 | Good 4.5% |
| Sierra Leoneans | 64.3 /100 | #163 | Good 4.5% |
| Swiss | 61.0 /100 | #164 | Good 4.5% |
| Costa Ricans | 59.9 /100 | #165 | Average 4.5% |
| Immigrants | Colombia | 59.4 /100 | #166 | Average 4.5% |
| Immigrants | Afghanistan | 59.2 /100 | #167 | Average 4.5% |
| Immigrants | Sierra Leone | 58.7 /100 | #168 | Average 4.5% |
| Chinese | 58.6 /100 | #169 | Average 4.5% |
| Immigrants | Zaire | 57.4 /100 | #170 | Average 4.5% |
| Immigrants | Bangladesh | 56.0 /100 | #171 | Average 4.4% |
| Spaniards | 52.0 /100 | #172 | Average 4.4% |
| English | 50.1 /100 | #173 | Average 4.4% |
| Kenyans | 50.0 /100 | #174 | Average 4.4% |
| Irish | 50.0 /100 | #175 | Average 4.4% |
| Immigrants | Peru | 49.3 /100 | #176 | Average 4.4% |