Irish vs Cuban Associate's Degree
COMPARE
Irish
Cuban
Associate's Degree
Associate's Degree Comparison
Irish
Cubans
46.5%
ASSOCIATE'S DEGREE
53.6/ 100
METRIC RATING
170th/ 347
METRIC RANK
41.9%
ASSOCIATE'S DEGREE
0.6/ 100
METRIC RATING
254th/ 347
METRIC RANK
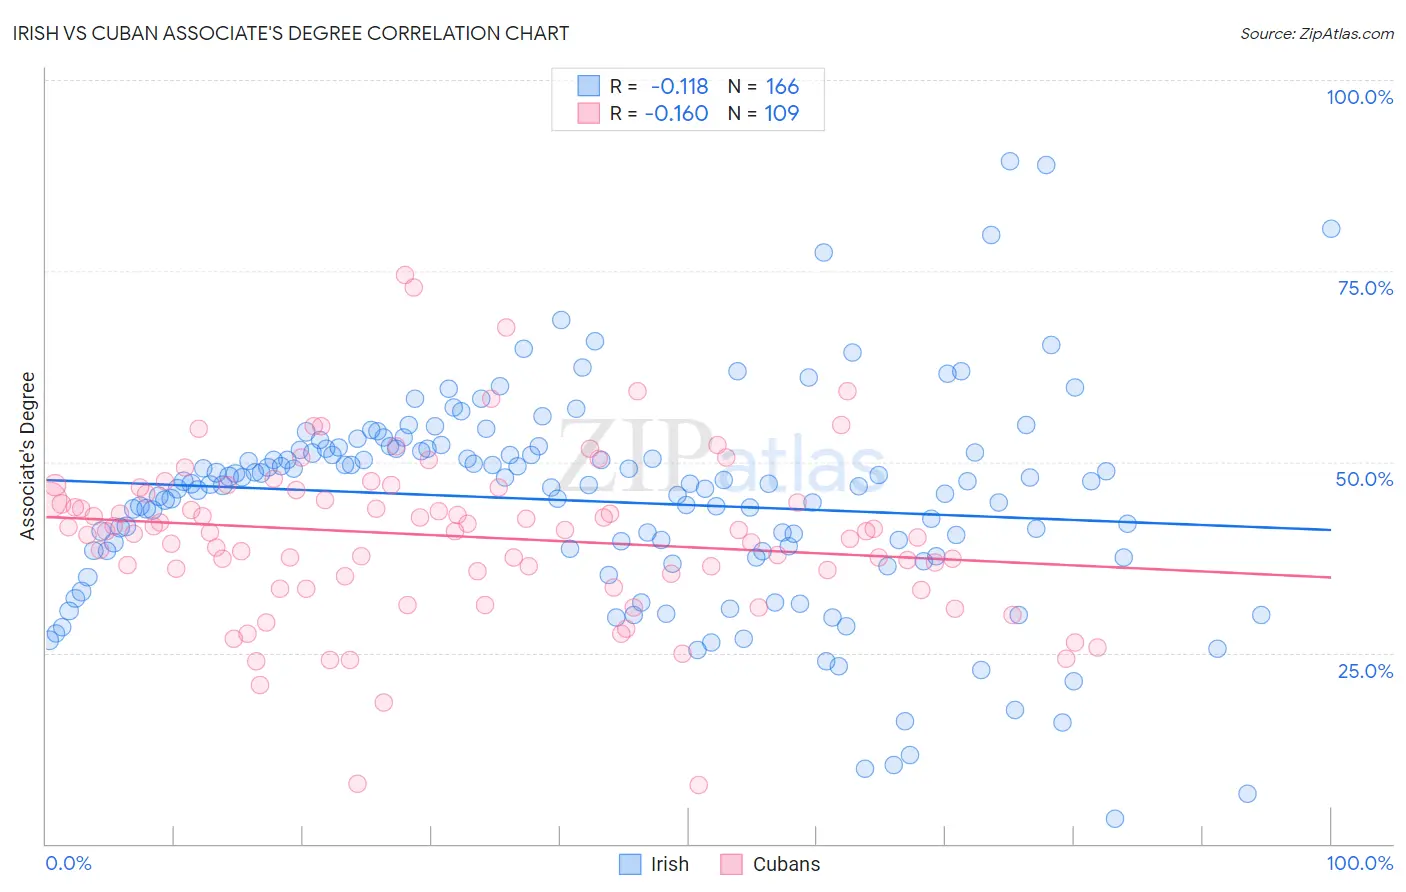
Irish vs Cuban Associate's Degree Correlation Chart
The statistical analysis conducted on geographies consisting of 580,555,022 people shows a poor negative correlation between the proportion of Irish and percentage of population with at least associate's degree education in the United States with a correlation coefficient (R) of -0.118 and weighted average of 46.5%. Similarly, the statistical analysis conducted on geographies consisting of 449,326,407 people shows a poor negative correlation between the proportion of Cubans and percentage of population with at least associate's degree education in the United States with a correlation coefficient (R) of -0.160 and weighted average of 41.9%, a difference of 11.0%.
Associate's Degree Correlation Summary
| Measurement | Irish | Cuban |
| Minimum | 3.2% | 7.8% |
| Maximum | 89.4% | 74.4% |
| Range | 86.2% | 66.7% |
| Mean | 44.9% | 40.3% |
| Median | 47.1% | 41.0% |
| Interquartile 25% (IQ1) | 38.3% | 35.1% |
| Interquartile 75% (IQ3) | 51.7% | 46.0% |
| Interquartile Range (IQR) | 13.4% | 10.9% |
| Standard Deviation (Sample) | 13.9% | 10.9% |
| Standard Deviation (Population) | 13.9% | 10.8% |
Similar Demographics by Associate's Degree
Demographics Similar to Irish by Associate's Degree
In terms of associate's degree, the demographic groups most similar to Irish are Basque (46.5%, a difference of 0.060%), Uruguayan (46.5%, a difference of 0.13%), Immigrants from Somalia (46.5%, a difference of 0.14%), Peruvian (46.4%, a difference of 0.24%), and Immigrants from Iraq (46.4%, a difference of 0.25%).
| Demographics | Rating | Rank | Associate's Degree |
| Somalis | 62.5 /100 | #163 | Good 46.8% |
| Colombians | 62.4 /100 | #164 | Good 46.8% |
| Immigrants | South America | 59.9 /100 | #165 | Average 46.7% |
| Hungarians | 59.3 /100 | #166 | Average 46.7% |
| Immigrants | Sierra Leone | 59.2 /100 | #167 | Average 46.7% |
| Immigrants | Somalia | 55.5 /100 | #168 | Average 46.5% |
| Uruguayans | 55.4 /100 | #169 | Average 46.5% |
| Irish | 53.6 /100 | #170 | Average 46.5% |
| Basques | 52.8 /100 | #171 | Average 46.5% |
| Peruvians | 50.5 /100 | #172 | Average 46.4% |
| Immigrants | Iraq | 50.3 /100 | #173 | Average 46.4% |
| English | 50.0 /100 | #174 | Average 46.4% |
| Belgians | 48.9 /100 | #175 | Average 46.3% |
| Finns | 48.5 /100 | #176 | Average 46.3% |
| Slovaks | 48.4 /100 | #177 | Average 46.3% |
Demographics Similar to Cubans by Associate's Degree
In terms of associate's degree, the demographic groups most similar to Cubans are Indonesian (41.9%, a difference of 0.060%), Immigrants from Guyana (41.8%, a difference of 0.090%), French American Indian (42.0%, a difference of 0.17%), Immigrants from Congo (41.8%, a difference of 0.21%), and Spanish American (41.8%, a difference of 0.27%).
| Demographics | Rating | Rank | Associate's Degree |
| Immigrants | Fiji | 0.8 /100 | #247 | Tragic 42.2% |
| Immigrants | Ecuador | 0.8 /100 | #248 | Tragic 42.2% |
| Jamaicans | 0.7 /100 | #249 | Tragic 42.1% |
| U.S. Virgin Islanders | 0.7 /100 | #250 | Tragic 42.1% |
| Immigrants | Bahamas | 0.7 /100 | #251 | Tragic 42.1% |
| French American Indians | 0.6 /100 | #252 | Tragic 42.0% |
| Indonesians | 0.6 /100 | #253 | Tragic 41.9% |
| Cubans | 0.6 /100 | #254 | Tragic 41.9% |
| Immigrants | Guyana | 0.5 /100 | #255 | Tragic 41.8% |
| Immigrants | Congo | 0.5 /100 | #256 | Tragic 41.8% |
| Spanish Americans | 0.5 /100 | #257 | Tragic 41.8% |
| Japanese | 0.5 /100 | #258 | Tragic 41.7% |
| Malaysians | 0.4 /100 | #259 | Tragic 41.6% |
| Marshallese | 0.4 /100 | #260 | Tragic 41.6% |
| Nicaraguans | 0.4 /100 | #261 | Tragic 41.5% |