Irish vs Immigrants from Cabo Verde Nursery School
COMPARE
Irish
Immigrants from Cabo Verde
Nursery School
Nursery School Comparison
Irish
Immigrants from Cabo Verde
98.6%
NURSERY SCHOOL
100.0/ 100
METRIC RATING
19th/ 347
METRIC RANK
96.4%
NURSERY SCHOOL
0.0/ 100
METRIC RATING
341st/ 347
METRIC RANK
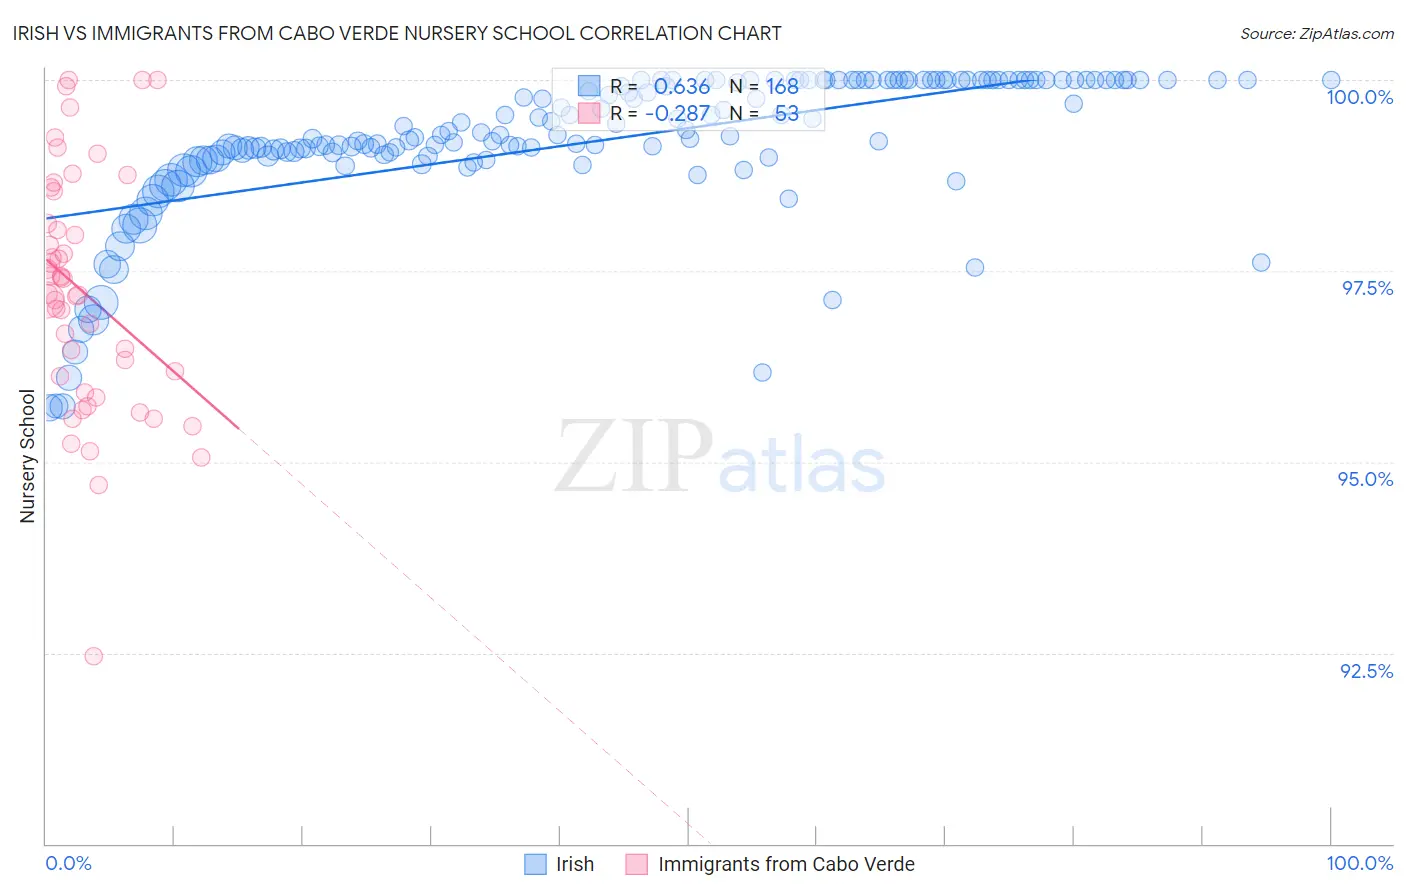
Irish vs Immigrants from Cabo Verde Nursery School Correlation Chart
The statistical analysis conducted on geographies consisting of 580,708,963 people shows a significant positive correlation between the proportion of Irish and percentage of population with at least nursery school education in the United States with a correlation coefficient (R) of 0.636 and weighted average of 98.6%. Similarly, the statistical analysis conducted on geographies consisting of 38,158,666 people shows a weak negative correlation between the proportion of Immigrants from Cabo Verde and percentage of population with at least nursery school education in the United States with a correlation coefficient (R) of -0.287 and weighted average of 96.4%, a difference of 2.3%.
Nursery School Correlation Summary
| Measurement | Irish | Immigrants from Cabo Verde |
| Minimum | 95.7% | 92.5% |
| Maximum | 100.0% | 100.0% |
| Range | 4.3% | 7.5% |
| Mean | 99.2% | 97.2% |
| Median | 99.3% | 97.2% |
| Interquartile 25% (IQ1) | 99.0% | 96.0% |
| Interquartile 75% (IQ3) | 100.0% | 98.3% |
| Interquartile Range (IQR) | 1.00% | 2.3% |
| Standard Deviation (Sample) | 0.94% | 1.6% |
| Standard Deviation (Population) | 0.94% | 1.5% |
Similar Demographics by Nursery School
Demographics Similar to Irish by Nursery School
In terms of nursery school, the demographic groups most similar to Irish are Pennsylvania German (98.6%, a difference of 0.010%), Finnish (98.6%, a difference of 0.010%), Lithuanian (98.6%, a difference of 0.010%), Polish (98.6%, a difference of 0.010%), and Danish (98.6%, a difference of 0.010%).
| Demographics | Rating | Rank | Nursery School |
| Slovenes | 100.0 /100 | #12 | Exceptional 98.7% |
| English | 100.0 /100 | #13 | Exceptional 98.7% |
| Carpatho Rusyns | 100.0 /100 | #14 | Exceptional 98.7% |
| Swedes | 100.0 /100 | #15 | Exceptional 98.7% |
| Scottish | 100.0 /100 | #16 | Exceptional 98.7% |
| Aleuts | 100.0 /100 | #17 | Exceptional 98.7% |
| Dutch | 100.0 /100 | #18 | Exceptional 98.7% |
| Irish | 100.0 /100 | #19 | Exceptional 98.6% |
| Pennsylvania Germans | 100.0 /100 | #20 | Exceptional 98.6% |
| Finns | 100.0 /100 | #21 | Exceptional 98.6% |
| Lithuanians | 100.0 /100 | #22 | Exceptional 98.6% |
| Poles | 100.0 /100 | #23 | Exceptional 98.6% |
| Danes | 100.0 /100 | #24 | Exceptional 98.6% |
| Scotch-Irish | 100.0 /100 | #25 | Exceptional 98.6% |
| Sioux | 100.0 /100 | #26 | Exceptional 98.6% |
Demographics Similar to Immigrants from Cabo Verde by Nursery School
In terms of nursery school, the demographic groups most similar to Immigrants from Cabo Verde are Immigrants from Mexico (96.4%, a difference of 0.010%), Immigrants from Central America (96.4%, a difference of 0.020%), Salvadoran (96.4%, a difference of 0.040%), Immigrants from Guatemala (96.4%, a difference of 0.060%), and Immigrants from Cambodia (96.5%, a difference of 0.13%).
| Demographics | Rating | Rank | Nursery School |
| Central Americans | 0.0 /100 | #333 | Tragic 96.6% |
| Immigrants | Dominican Republic | 0.0 /100 | #334 | Tragic 96.6% |
| Bangladeshis | 0.0 /100 | #335 | Tragic 96.6% |
| Guatemalans | 0.0 /100 | #336 | Tragic 96.6% |
| Immigrants | Cambodia | 0.0 /100 | #337 | Tragic 96.5% |
| Immigrants | Fiji | 0.0 /100 | #338 | Tragic 96.5% |
| Immigrants | Guatemala | 0.0 /100 | #339 | Tragic 96.4% |
| Immigrants | Central America | 0.0 /100 | #340 | Tragic 96.4% |
| Immigrants | Cabo Verde | 0.0 /100 | #341 | Tragic 96.4% |
| Immigrants | Mexico | 0.0 /100 | #342 | Tragic 96.4% |
| Salvadorans | 0.0 /100 | #343 | Tragic 96.4% |
| Immigrants | El Salvador | 0.0 /100 | #344 | Tragic 96.2% |
| Nepalese | 0.0 /100 | #345 | Tragic 96.2% |
| Immigrants | Yemen | 0.0 /100 | #346 | Tragic 95.9% |
| Spanish American Indians | 0.0 /100 | #347 | Tragic 95.8% |