Irish vs Immigrants from El Salvador 11th Grade
COMPARE
Irish
Immigrants from El Salvador
11th Grade
11th Grade Comparison
Irish
Immigrants from El Salvador
94.4%
11TH GRADE
100.0/ 100
METRIC RATING
25th/ 347
METRIC RANK
85.3%
11TH GRADE
0.0/ 100
METRIC RATING
343rd/ 347
METRIC RANK
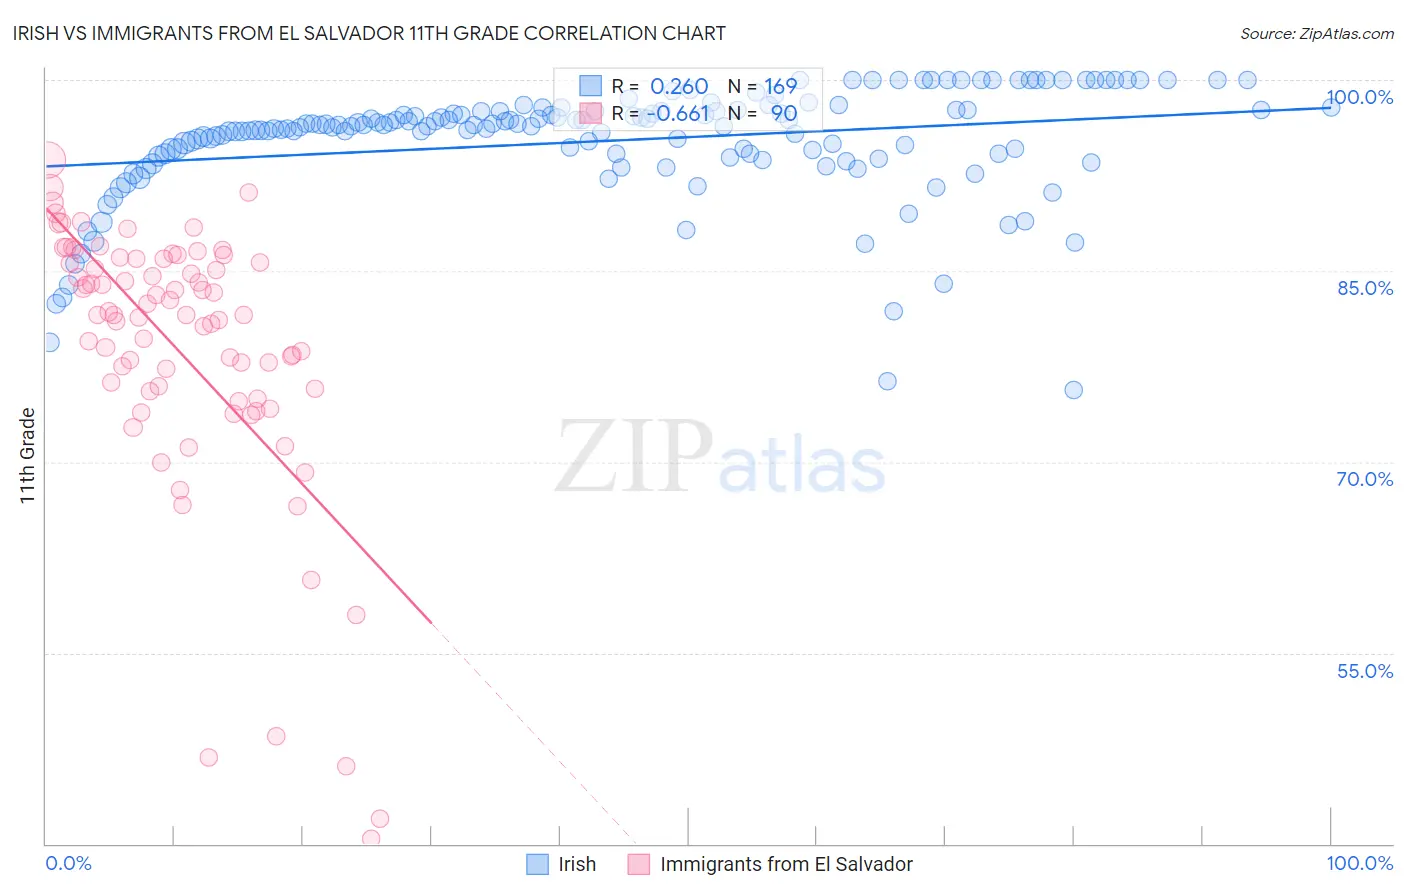
Irish vs Immigrants from El Salvador 11th Grade Correlation Chart
The statistical analysis conducted on geographies consisting of 580,710,164 people shows a weak positive correlation between the proportion of Irish and percentage of population with at least 11th grade education in the United States with a correlation coefficient (R) of 0.260 and weighted average of 94.4%. Similarly, the statistical analysis conducted on geographies consisting of 357,852,938 people shows a significant negative correlation between the proportion of Immigrants from El Salvador and percentage of population with at least 11th grade education in the United States with a correlation coefficient (R) of -0.661 and weighted average of 85.3%, a difference of 10.6%.
11th Grade Correlation Summary
| Measurement | Irish | Immigrants from El Salvador |
| Minimum | 75.7% | 40.3% |
| Maximum | 100.0% | 93.7% |
| Range | 24.3% | 53.3% |
| Mean | 95.2% | 78.8% |
| Median | 96.4% | 81.5% |
| Interquartile 25% (IQ1) | 94.1% | 75.6% |
| Interquartile 75% (IQ3) | 97.6% | 85.9% |
| Interquartile Range (IQR) | 3.4% | 10.4% |
| Standard Deviation (Sample) | 4.5% | 10.7% |
| Standard Deviation (Population) | 4.5% | 10.6% |
Similar Demographics by 11th Grade
Demographics Similar to Irish by 11th Grade
In terms of 11th grade, the demographic groups most similar to Irish are Scottish (94.4%, a difference of 0.0%), English (94.4%, a difference of 0.020%), European (94.4%, a difference of 0.020%), Estonian (94.4%, a difference of 0.030%), and Tsimshian (94.4%, a difference of 0.050%).
| Demographics | Rating | Rank | 11th Grade |
| Maltese | 100.0 /100 | #18 | Exceptional 94.5% |
| Scandinavians | 100.0 /100 | #19 | Exceptional 94.5% |
| Italians | 100.0 /100 | #20 | Exceptional 94.5% |
| Tlingit-Haida | 100.0 /100 | #21 | Exceptional 94.4% |
| Tsimshian | 100.0 /100 | #22 | Exceptional 94.4% |
| Czechs | 100.0 /100 | #23 | Exceptional 94.4% |
| English | 100.0 /100 | #24 | Exceptional 94.4% |
| Irish | 100.0 /100 | #25 | Exceptional 94.4% |
| Scottish | 100.0 /100 | #26 | Exceptional 94.4% |
| Europeans | 100.0 /100 | #27 | Exceptional 94.4% |
| Estonians | 100.0 /100 | #28 | Exceptional 94.4% |
| Dutch | 100.0 /100 | #29 | Exceptional 94.3% |
| Russians | 100.0 /100 | #30 | Exceptional 94.3% |
| Welsh | 99.9 /100 | #31 | Exceptional 94.2% |
| Belgians | 99.9 /100 | #32 | Exceptional 94.2% |
Demographics Similar to Immigrants from El Salvador by 11th Grade
In terms of 11th grade, the demographic groups most similar to Immigrants from El Salvador are Yakama (85.0%, a difference of 0.40%), Immigrants from Central America (84.9%, a difference of 0.43%), Immigrants from Guatemala (85.8%, a difference of 0.61%), Spanish American Indian (84.7%, a difference of 0.68%), and Mexican (86.1%, a difference of 0.94%).
| Demographics | Rating | Rank | 11th Grade |
| Immigrants | Yemen | 0.0 /100 | #333 | Tragic 87.1% |
| Houma | 0.0 /100 | #334 | Tragic 87.0% |
| Central Americans | 0.0 /100 | #335 | Tragic 86.9% |
| Immigrants | Dominican Republic | 0.0 /100 | #336 | Tragic 86.9% |
| Immigrants | Honduras | 0.0 /100 | #337 | Tragic 86.9% |
| Immigrants | Latin America | 0.0 /100 | #338 | Tragic 86.8% |
| Guatemalans | 0.0 /100 | #339 | Tragic 86.4% |
| Salvadorans | 0.0 /100 | #340 | Tragic 86.2% |
| Mexicans | 0.0 /100 | #341 | Tragic 86.1% |
| Immigrants | Guatemala | 0.0 /100 | #342 | Tragic 85.8% |
| Immigrants | El Salvador | 0.0 /100 | #343 | Tragic 85.3% |
| Yakama | 0.0 /100 | #344 | Tragic 85.0% |
| Immigrants | Central America | 0.0 /100 | #345 | Tragic 84.9% |
| Spanish American Indians | 0.0 /100 | #346 | Tragic 84.7% |
| Immigrants | Mexico | 0.0 /100 | #347 | Tragic 84.5% |