Irish vs Immigrants from Iraq 11th Grade

COMPARE

Irish
Race
Ancestry
AfghanAfricanAlaska NativeAlaskan AthabascanAlbanianAleutAlsatianAmericanApacheArabArapahoArgentineanArmenianAssyrian/Chaldean/SyriacAustralianAustrianBahamianBangladeshiBarbadianBasqueBelgianBelizeanBermudanBhutaneseBlackfeetBolivianBrazilianBritishBritish West IndianBulgarianBurmeseCajunCambodianCanadianCape VerdeanCarpatho RusynCelticCentral AmericanCentral American IndianCherokeeCheyenneChickasawChileanChineseChippewaChoctawColombianColvilleComancheCosta RicanCreeCreekCroatianCrowCubanCypriotCzechCzechoslovakianDanishDelawareDominicanDutchDutch West IndianEastern EuropeanEcuadorianEgyptianEnglishEstonianEthiopianEuropeanFijianFilipinoFinnishFrenchFrench American IndianFrench CanadianGermanGerman RussianGhanaianGreekGuamanian/ChamorroGuatemalanGuyaneseHaitianHmongHonduranHopiHoumaHungarianIcelanderIndian (Asian)IndonesianInupiatIranianIraqiIrishIroquoisIsraeliItalianJamaicanJapaneseJordanianKenyanKiowaKoreanLaotianLatvianLebaneseLiberianLithuanianLumbeeLuxembourgerMacedonianMalaysianMalteseMarshalleseMenomineeMexicanMexican American IndianMongolianMoroccanNative HawaiianNavajoNepaleseNew ZealanderNicaraguanNigerianNorthern EuropeanNorwegianOkinawanOsageOttawaPaiutePakistaniPalestinianPanamanianParaguayanPennsylvania GermanPeruvianPimaPolishPortuguesePotawatomiPuebloPuerto RicanPuget Sound SalishRomanianRussianSalvadoranSamoanScandinavianScotch-IrishScottishSeminoleSenegaleseSerbianShoshoneSierra LeoneanSiouxSlavicSlovakSloveneSomaliSouth AfricanSouth AmericanSouth American IndianSoviet UnionSpaniardSpanishSpanish AmericanSpanish American IndianSri LankanSubsaharan AfricanSudaneseSwedishSwissSyrianTaiwaneseThaiTlingit-HaidaTohono O'OdhamTonganTrinidadian and TobagonianTsimshianTurkishU.S. Virgin IslanderUgandanUkrainianUruguayanUteVenezuelanVietnameseWelshWest IndianYakamaYaquiYugoslavianYumanYup'ikZimbabwean
Immigration
NonimmigrantsImmigrantsAfghanistanAfricaAlbaniaArgentinaArmeniaAsiaAustraliaAustriaBahamasBangladeshBarbadosBelarusBelgiumBelizeBoliviaBosnia and HerzegovinaBrazilBulgariaBurma/MyanmarCabo VerdeCambodiaCameroonCanadaCaribbeanCentral AmericaChileChinaColombiaCongoCosta RicaCroatiaCubaCzechoslovakiaDenmarkDominicaDominican RepublicEastern AfricaEastern AsiaEastern EuropeEcuadorEgyptEl SalvadorEnglandEritreaEthiopiaEuropeFijiFranceGermanyGhanaGreeceGrenadaGuatemalaGuyanaHaitiHondurasHong KongHungaryIndiaIndonesiaIranIrelandIsraelItalyJamaicaJapanJordanKazakhstanKenyaKoreaKuwaitLaosLatin AmericaLatviaLebanonLiberiaLithuaniaMalaysiaMexicoMicronesiaMiddle AfricaMoldovaMoroccoNepalNetherlandsNicaraguaNigeriaNorth AmericaNorth MacedoniaNorthern AfricaNorthern EuropeNorwayOceaniaPakistanPanamaPeruPhilippinesPolandPortugalRomaniaRussiaSaudi ArabiaScotlandSenegalSerbiaSierra LeoneSingaporeSomaliaSouth AfricaSouth AmericaSouth Central AsiaSouth Eastern AsiaSouthern EuropeSpainSri LankaSt. Vincent and the GrenadinesSudanSwedenSwitzerlandSyriaTaiwanThailandTrinidad and TobagoTurkeyUgandaUkraineUruguayUzbekistanVenezuelaVietnamWest IndiesWestern AfricaWestern AsiaWestern EuropeYemenZaireZimbabweAzores
Immigrants from Iraq
Race
Ancestry
AfghanAfricanAlaska NativeAlaskan AthabascanAlbanianAleutAlsatianAmericanApacheArabArapahoArgentineanArmenianAssyrian/Chaldean/SyriacAustralianAustrianBahamianBangladeshiBarbadianBasqueBelgianBelizeanBermudanBhutaneseBlackfeetBolivianBrazilianBritishBritish West IndianBulgarianBurmeseCajunCambodianCanadianCape VerdeanCarpatho RusynCelticCentral AmericanCentral American IndianCherokeeCheyenneChickasawChileanChineseChippewaChoctawColombianColvilleComancheCosta RicanCreeCreekCroatianCrowCubanCypriotCzechCzechoslovakianDanishDelawareDominicanDutchDutch West IndianEastern EuropeanEcuadorianEgyptianEnglishEstonianEthiopianEuropeanFijianFilipinoFinnishFrenchFrench American IndianFrench CanadianGermanGerman RussianGhanaianGreekGuamanian/ChamorroGuatemalanGuyaneseHaitianHmongHonduranHopiHoumaHungarianIcelanderIndian (Asian)IndonesianInupiatIranianIraqiIroquoisIsraeliItalianJamaicanJapaneseJordanianKenyanKiowaKoreanLaotianLatvianLebaneseLiberianLithuanianLumbeeLuxembourgerMacedonianMalaysianMalteseMarshalleseMenomineeMexicanMexican American IndianMongolianMoroccanNative HawaiianNavajoNepaleseNew ZealanderNicaraguanNigerianNorthern EuropeanNorwegianOkinawanOsageOttawaPaiutePakistaniPalestinianPanamanianParaguayanPennsylvania GermanPeruvianPimaPolishPortuguesePotawatomiPuebloPuerto RicanPuget Sound SalishRomanianRussianSalvadoranSamoanScandinavianScotch-IrishScottishSeminoleSenegaleseSerbianShoshoneSierra LeoneanSiouxSlavicSlovakSloveneSomaliSouth AfricanSouth AmericanSouth American IndianSoviet UnionSpaniardSpanishSpanish AmericanSpanish American IndianSri LankanSubsaharan AfricanSudaneseSwedishSwissSyrianTaiwaneseThaiTlingit-HaidaTohono O'OdhamTonganTrinidadian and TobagonianTsimshianTurkishU.S. Virgin IslanderUgandanUkrainianUruguayanUteVenezuelanVietnameseWelshWest IndianYakamaYaquiYugoslavianYumanYup'ikZimbabwean
Immigration
NonimmigrantsImmigrantsAfghanistanAfricaAlbaniaArgentinaArmeniaAsiaAustraliaAustriaBahamasBangladeshBarbadosBelarusBelgiumBelizeBoliviaBosnia and HerzegovinaBrazilBulgariaBurma/MyanmarCabo VerdeCambodiaCameroonCanadaCaribbeanCentral AmericaChileChinaColombiaCongoCosta RicaCroatiaCubaCzechoslovakiaDenmarkDominicaDominican RepublicEastern AfricaEastern AsiaEastern EuropeEcuadorEgyptEl SalvadorEnglandEritreaEthiopiaEuropeFijiFranceGermanyGhanaGreeceGrenadaGuatemalaGuyanaHaitiHondurasHong KongHungaryIndiaIndonesiaIranIraqIrelandIsraelItalyJamaicaJapanJordanKazakhstanKenyaKoreaKuwaitLaosLatin AmericaLatviaLebanonLiberiaLithuaniaMalaysiaMexicoMicronesiaMiddle AfricaMoldovaMoroccoNepalNetherlandsNicaraguaNigeriaNorth AmericaNorth MacedoniaNorthern AfricaNorthern EuropeNorwayOceaniaPakistanPanamaPeruPhilippinesPolandPortugalRomaniaRussiaSaudi ArabiaScotlandSenegalSerbiaSierra LeoneSingaporeSomaliaSouth AfricaSouth AmericaSouth Central AsiaSouth Eastern AsiaSouthern EuropeSpainSri LankaSt. Vincent and the GrenadinesSudanSwedenSwitzerlandSyriaTaiwanThailandTrinidad and TobagoTurkeyUgandaUkraineUruguayUzbekistanVenezuelaVietnamWest IndiesWestern AfricaWestern AsiaWestern EuropeYemenZaireZimbabweAzores
11th Grade
Income
Poverty
Unemployment
Labor Participation
Family Structure
Vehicle Availability
Education Level
Disability

11th Grade Comparison

Irish

Immigrants from Iraq

Exceptional
Good
94.4%
11TH GRADE
100.0/ 100
METRIC RATING
25th/ 347
METRIC RANK
92.6%
11TH GRADE
63.7/ 100
METRIC RATING
165th/ 347
METRIC RANK

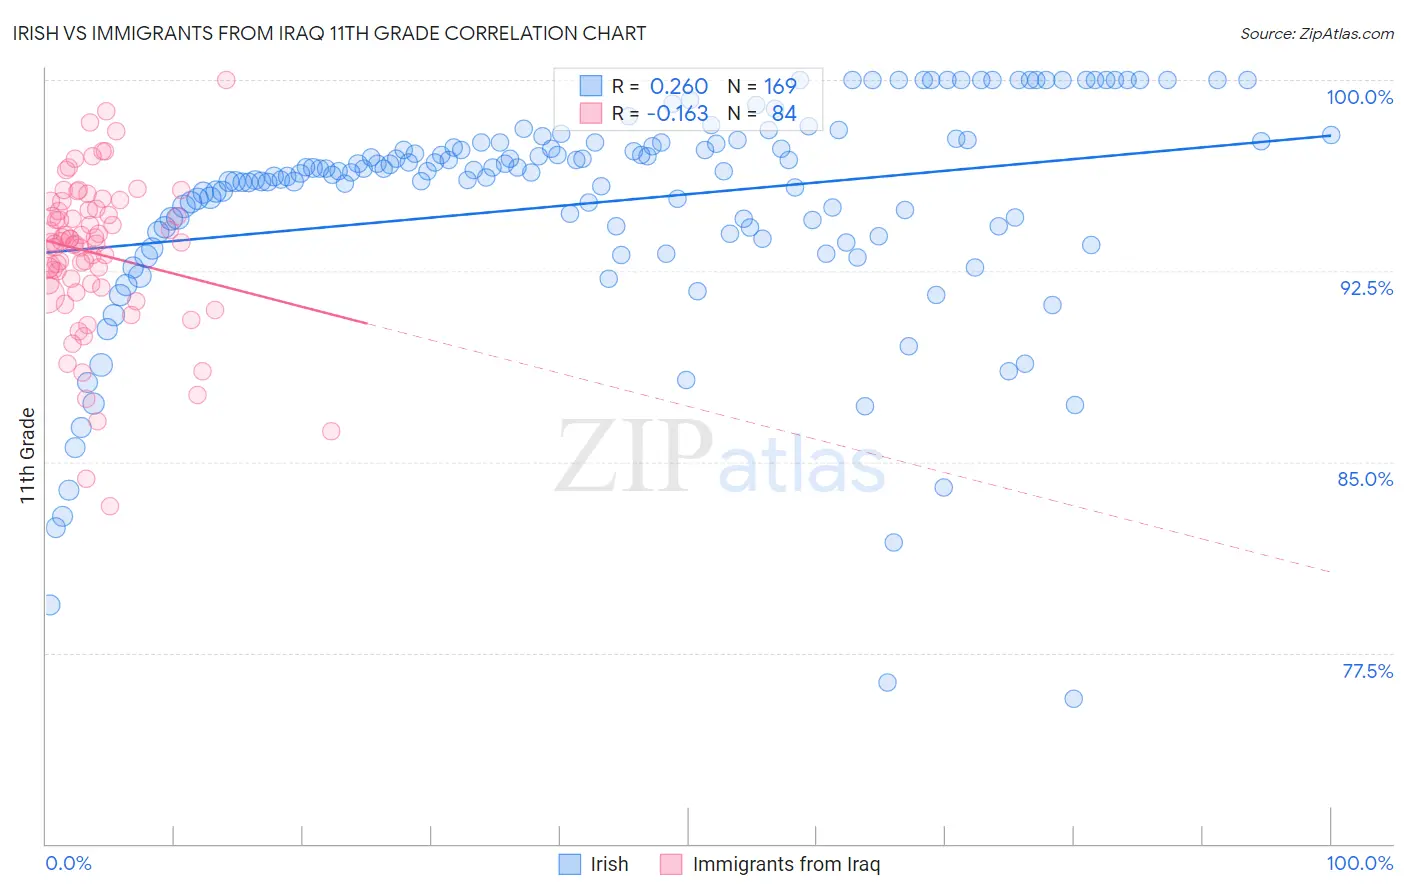
Irish vs Immigrants from Iraq 11th Grade Correlation Chart

The statistical analysis conducted on geographies consisting of 580,710,164 people shows a weak positive correlation between the proportion of Irish and percentage of population with at least 11th grade education in the United States with a correlation coefficient (R) of 0.260 and weighted average of 94.4%. Similarly, the statistical analysis conducted on geographies consisting of 194,685,376 people shows a poor negative correlation between the proportion of Immigrants from Iraq and percentage of population with at least 11th grade education in the United States with a correlation coefficient (R) of -0.163 and weighted average of 92.6%, a difference of 1.9%.
Irish vs Immigrants from Iraq 11th Grade

11th Grade Correlation Summary

MeasurementIrishImmigrants from Iraq
Minimum75.7%83.3%
Maximum100.0%100.0%
Range24.3%16.7%
Mean95.2%93.2%
Median96.4%93.6%
Interquartile 25% (IQ1)94.1%91.9%
Interquartile 75% (IQ3)97.6%94.9%
Interquartile Range (IQR)3.4%3.0%
Standard Deviation (Sample)4.5%3.0%
Standard Deviation (Population)4.5%3.0%

Similar Demographics by 11th Grade

Demographics Similar to Irish by 11th Grade

In terms of 11th grade, the demographic groups most similar to Irish are Scottish (94.4%, a difference of 0.0%), English (94.4%, a difference of 0.020%), European (94.4%, a difference of 0.020%), Estonian (94.4%, a difference of 0.030%), and Tsimshian (94.4%, a difference of 0.050%).
DemographicsRating | Rank11th Grade
Maltese
100.0
/100
|
#18
Exceptional
94.5%
Scandinavians
100.0
/100
|
#19
Exceptional
94.5%
Italians
100.0
/100
|
#20
Exceptional
94.5%
Tlingit-Haida
100.0
/100
|
#21
Exceptional
94.4%
Tsimshian
100.0
/100
|
#22
Exceptional
94.4%
Czechs
100.0
/100
|
#23
Exceptional
94.4%
English
100.0
/100
|
#24
Exceptional
94.4%
Irish
100.0
/100
|
#25
Exceptional
94.4%
Scottish
100.0
/100
|
#26
Exceptional
94.4%
Europeans
100.0
/100
|
#27
Exceptional
94.4%
Estonians
100.0
/100
|
#28
Exceptional
94.4%
Dutch
100.0
/100
|
#29
Exceptional
94.3%
Russians
100.0
/100
|
#30
Exceptional
94.3%
Welsh
99.9
/100
|
#31
Exceptional
94.2%
Belgians
99.9
/100
|
#32
Exceptional
94.2%

Demographics Similar to Immigrants from Iraq by 11th Grade

In terms of 11th grade, the demographic groups most similar to Immigrants from Iraq are Bermudan (92.6%, a difference of 0.010%), Nonimmigrants (92.7%, a difference of 0.030%), Spanish (92.7%, a difference of 0.030%), Alsatian (92.6%, a difference of 0.040%), and Paraguayan (92.7%, a difference of 0.050%).
DemographicsRating | Rank11th Grade
Immigrants | Venezuela
72.0
/100
|
#158
Good
92.7%
Americans
71.7
/100
|
#159
Good
92.7%
Immigrants | Lebanon
70.7
/100
|
#160
Good
92.7%
Immigrants | Argentina
69.8
/100
|
#161
Good
92.7%
Paraguayans
68.7
/100
|
#162
Good
92.7%
Immigrants | Nonimmigrants
66.6
/100
|
#163
Good
92.7%
Spanish
66.2
/100
|
#164
Good
92.7%
Immigrants | Iraq
63.7
/100
|
#165
Good
92.6%
Bermudans
62.3
/100
|
#166
Good
92.6%
Alsatians
60.2
/100
|
#167
Good
92.6%
Sierra Leoneans
58.7
/100
|
#168
Average
92.6%
Immigrants | Albania
57.8
/100
|
#169
Average
92.6%
Immigrants | Northern Africa
57.3
/100
|
#170
Average
92.6%
Laotians
54.4
/100
|
#171
Average
92.6%
Immigrants | Pakistan
52.3
/100
|
#172
Average
92.5%