Iraqi vs Argentinean Bachelor's Degree
COMPARE
Iraqi
Argentinean
Bachelor's Degree
Bachelor's Degree Comparison
Iraqis
Argentineans
39.0%
BACHELOR'S DEGREE
78.1/ 100
METRIC RATING
148th/ 347
METRIC RANK
43.3%
BACHELOR'S DEGREE
99.7/ 100
METRIC RATING
64th/ 347
METRIC RANK
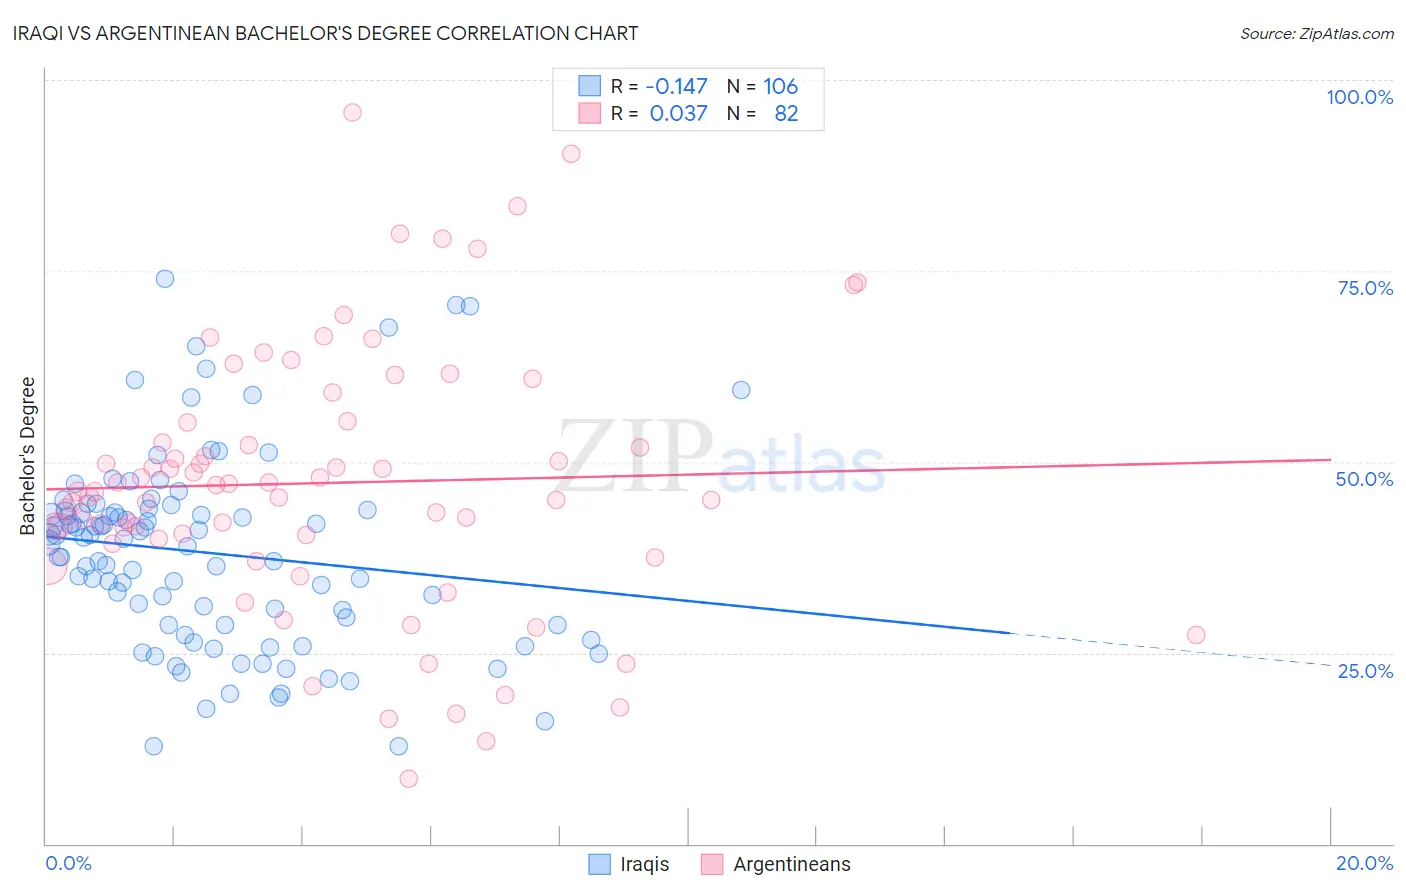
Iraqi vs Argentinean Bachelor's Degree Correlation Chart
The statistical analysis conducted on geographies consisting of 170,654,288 people shows a poor negative correlation between the proportion of Iraqis and percentage of population with at least bachelor's degree education in the United States with a correlation coefficient (R) of -0.147 and weighted average of 39.0%. Similarly, the statistical analysis conducted on geographies consisting of 297,127,531 people shows no correlation between the proportion of Argentineans and percentage of population with at least bachelor's degree education in the United States with a correlation coefficient (R) of 0.037 and weighted average of 43.3%, a difference of 11.0%.
Bachelor's Degree Correlation Summary
| Measurement | Iraqi | Argentinean |
| Minimum | 12.8% | 8.5% |
| Maximum | 74.1% | 95.7% |
| Range | 61.3% | 87.3% |
| Mean | 38.1% | 47.2% |
| Median | 39.7% | 46.1% |
| Interquartile 25% (IQ1) | 28.6% | 39.9% |
| Interquartile 75% (IQ3) | 43.6% | 55.1% |
| Interquartile Range (IQR) | 15.0% | 15.2% |
| Standard Deviation (Sample) | 12.6% | 17.3% |
| Standard Deviation (Population) | 12.5% | 17.1% |
Similar Demographics by Bachelor's Degree
Demographics Similar to Iraqis by Bachelor's Degree
In terms of bachelor's degree, the demographic groups most similar to Iraqis are Immigrants from Poland (39.0%, a difference of 0.080%), South American (38.9%, a difference of 0.11%), Immigrants from Sierra Leone (39.0%, a difference of 0.14%), Swedish (39.1%, a difference of 0.17%), and Slovene (39.1%, a difference of 0.21%).
| Demographics | Rating | Rank | Bachelor's Degree |
| South American Indians | 83.6 /100 | #141 | Excellent 39.3% |
| Immigrants | North Macedonia | 81.6 /100 | #142 | Excellent 39.2% |
| Poles | 79.8 /100 | #143 | Good 39.1% |
| Immigrants | Afghanistan | 79.7 /100 | #144 | Good 39.1% |
| Slovenes | 79.5 /100 | #145 | Good 39.1% |
| Swedes | 79.2 /100 | #146 | Good 39.1% |
| Immigrants | Sierra Leone | 79.0 /100 | #147 | Good 39.0% |
| Iraqis | 78.1 /100 | #148 | Good 39.0% |
| Immigrants | Poland | 77.5 /100 | #149 | Good 39.0% |
| South Americans | 77.3 /100 | #150 | Good 38.9% |
| Immigrants | Africa | 76.5 /100 | #151 | Good 38.9% |
| Sudanese | 76.4 /100 | #152 | Good 38.9% |
| Slavs | 75.9 /100 | #153 | Good 38.9% |
| Canadians | 75.0 /100 | #154 | Good 38.8% |
| Immigrants | Kenya | 73.8 /100 | #155 | Good 38.8% |
Demographics Similar to Argentineans by Bachelor's Degree
In terms of bachelor's degree, the demographic groups most similar to Argentineans are Zimbabwean (43.3%, a difference of 0.0%), Immigrants from Netherlands (43.3%, a difference of 0.020%), Egyptian (43.3%, a difference of 0.050%), Immigrants from Indonesia (43.3%, a difference of 0.070%), and Immigrants from Europe (43.4%, a difference of 0.27%).
| Demographics | Rating | Rank | Bachelor's Degree |
| Paraguayans | 99.9 /100 | #57 | Exceptional 44.0% |
| Immigrants | Czechoslovakia | 99.9 /100 | #58 | Exceptional 44.0% |
| Australians | 99.9 /100 | #59 | Exceptional 44.0% |
| New Zealanders | 99.9 /100 | #60 | Exceptional 44.0% |
| South Africans | 99.8 /100 | #61 | Exceptional 43.6% |
| Immigrants | Kazakhstan | 99.8 /100 | #62 | Exceptional 43.4% |
| Immigrants | Europe | 99.8 /100 | #63 | Exceptional 43.4% |
| Argentineans | 99.7 /100 | #64 | Exceptional 43.3% |
| Zimbabweans | 99.7 /100 | #65 | Exceptional 43.3% |
| Immigrants | Netherlands | 99.7 /100 | #66 | Exceptional 43.3% |
| Egyptians | 99.7 /100 | #67 | Exceptional 43.3% |
| Immigrants | Indonesia | 99.7 /100 | #68 | Exceptional 43.3% |
| Immigrants | Pakistan | 99.7 /100 | #69 | Exceptional 43.1% |
| Immigrants | Romania | 99.6 /100 | #70 | Exceptional 42.9% |
| Immigrants | Argentina | 99.6 /100 | #71 | Exceptional 42.8% |