Iraqi vs Immigrants from Burma/Myanmar Bachelor's Degree
COMPARE
Iraqi
Immigrants from Burma/Myanmar
Bachelor's Degree
Bachelor's Degree Comparison
Iraqis
Immigrants from Burma/Myanmar
39.0%
BACHELOR'S DEGREE
78.1/ 100
METRIC RATING
148th/ 347
METRIC RANK
35.5%
BACHELOR'S DEGREE
7.3/ 100
METRIC RATING
225th/ 347
METRIC RANK
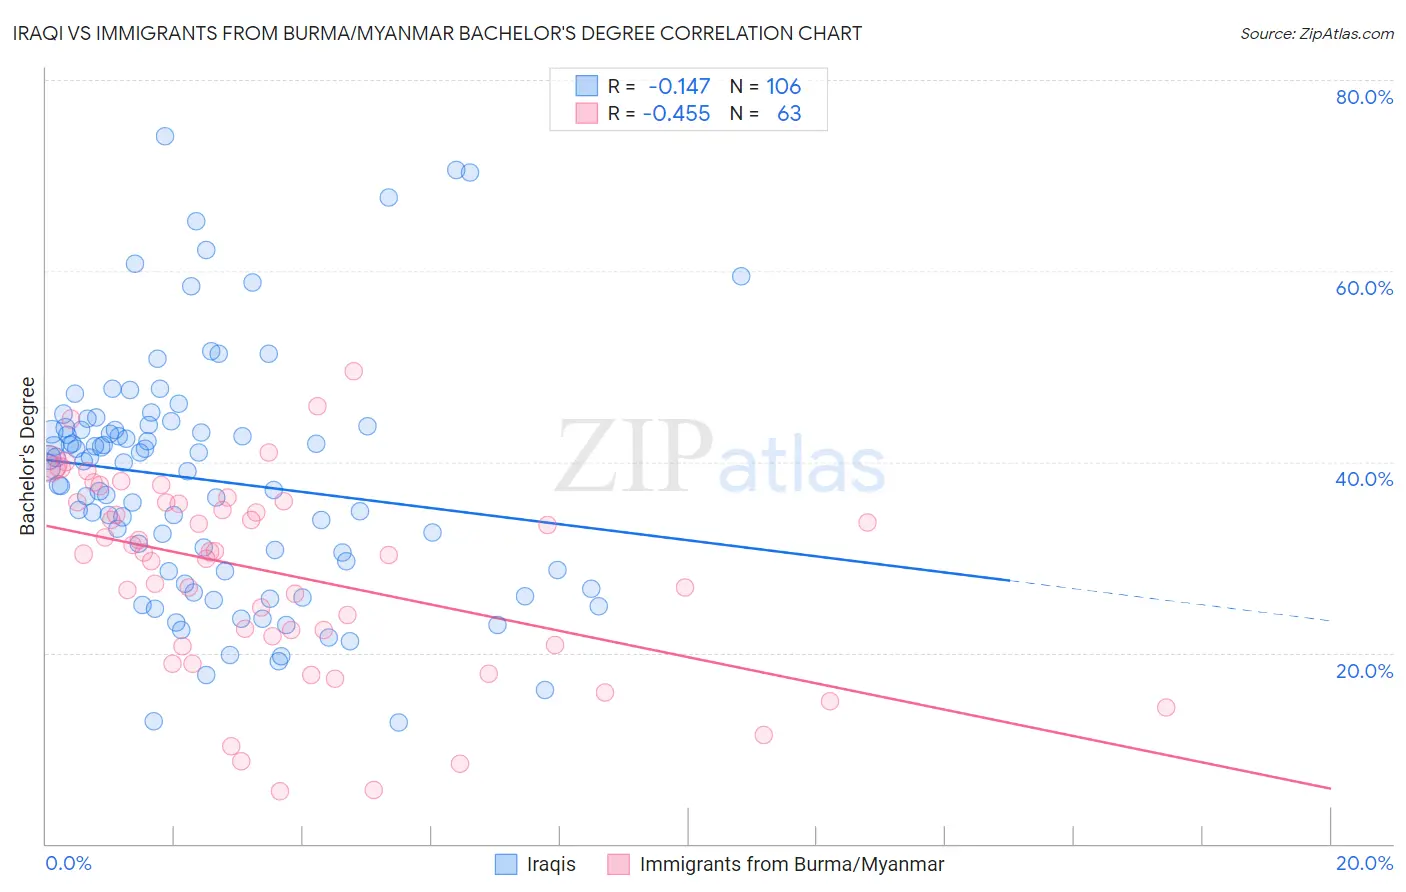
Iraqi vs Immigrants from Burma/Myanmar Bachelor's Degree Correlation Chart
The statistical analysis conducted on geographies consisting of 170,654,288 people shows a poor negative correlation between the proportion of Iraqis and percentage of population with at least bachelor's degree education in the United States with a correlation coefficient (R) of -0.147 and weighted average of 39.0%. Similarly, the statistical analysis conducted on geographies consisting of 172,337,344 people shows a moderate negative correlation between the proportion of Immigrants from Burma/Myanmar and percentage of population with at least bachelor's degree education in the United States with a correlation coefficient (R) of -0.455 and weighted average of 35.5%, a difference of 9.9%.
Bachelor's Degree Correlation Summary
| Measurement | Iraqi | Immigrants from Burma/Myanmar |
| Minimum | 12.8% | 5.5% |
| Maximum | 74.1% | 49.5% |
| Range | 61.3% | 44.0% |
| Mean | 38.1% | 28.4% |
| Median | 39.7% | 30.5% |
| Interquartile 25% (IQ1) | 28.6% | 20.8% |
| Interquartile 75% (IQ3) | 43.6% | 35.8% |
| Interquartile Range (IQR) | 15.0% | 15.0% |
| Standard Deviation (Sample) | 12.6% | 10.3% |
| Standard Deviation (Population) | 12.5% | 10.2% |
Similar Demographics by Bachelor's Degree
Demographics Similar to Iraqis by Bachelor's Degree
In terms of bachelor's degree, the demographic groups most similar to Iraqis are Immigrants from Poland (39.0%, a difference of 0.080%), South American (38.9%, a difference of 0.11%), Immigrants from Sierra Leone (39.0%, a difference of 0.14%), Swedish (39.1%, a difference of 0.17%), and Slovene (39.1%, a difference of 0.21%).
| Demographics | Rating | Rank | Bachelor's Degree |
| South American Indians | 83.6 /100 | #141 | Excellent 39.3% |
| Immigrants | North Macedonia | 81.6 /100 | #142 | Excellent 39.2% |
| Poles | 79.8 /100 | #143 | Good 39.1% |
| Immigrants | Afghanistan | 79.7 /100 | #144 | Good 39.1% |
| Slovenes | 79.5 /100 | #145 | Good 39.1% |
| Swedes | 79.2 /100 | #146 | Good 39.1% |
| Immigrants | Sierra Leone | 79.0 /100 | #147 | Good 39.0% |
| Iraqis | 78.1 /100 | #148 | Good 39.0% |
| Immigrants | Poland | 77.5 /100 | #149 | Good 39.0% |
| South Americans | 77.3 /100 | #150 | Good 38.9% |
| Immigrants | Africa | 76.5 /100 | #151 | Good 38.9% |
| Sudanese | 76.4 /100 | #152 | Good 38.9% |
| Slavs | 75.9 /100 | #153 | Good 38.9% |
| Canadians | 75.0 /100 | #154 | Good 38.8% |
| Immigrants | Kenya | 73.8 /100 | #155 | Good 38.8% |
Demographics Similar to Immigrants from Burma/Myanmar by Bachelor's Degree
In terms of bachelor's degree, the demographic groups most similar to Immigrants from Burma/Myanmar are Portuguese (35.5%, a difference of 0.040%), Immigrants from Barbados (35.5%, a difference of 0.070%), Ecuadorian (35.4%, a difference of 0.30%), French Canadian (35.6%, a difference of 0.35%), and Trinidadian and Tobagonian (35.7%, a difference of 0.52%).
| Demographics | Rating | Rank | Bachelor's Degree |
| Sub-Saharan Africans | 9.8 /100 | #218 | Tragic 35.8% |
| West Indians | 9.7 /100 | #219 | Tragic 35.8% |
| Spanish | 9.6 /100 | #220 | Tragic 35.8% |
| Dutch | 9.2 /100 | #221 | Tragic 35.7% |
| Trinidadians and Tobagonians | 8.8 /100 | #222 | Tragic 35.7% |
| French Canadians | 8.3 /100 | #223 | Tragic 35.6% |
| Immigrants | Barbados | 7.5 /100 | #224 | Tragic 35.5% |
| Immigrants | Burma/Myanmar | 7.3 /100 | #225 | Tragic 35.5% |
| Portuguese | 7.2 /100 | #226 | Tragic 35.5% |
| Ecuadorians | 6.6 /100 | #227 | Tragic 35.4% |
| Immigrants | Trinidad and Tobago | 6.0 /100 | #228 | Tragic 35.3% |
| Whites/Caucasians | 5.9 /100 | #229 | Tragic 35.3% |
| Immigrants | Grenada | 4.3 /100 | #230 | Tragic 35.0% |
| Immigrants | St. Vincent and the Grenadines | 4.3 /100 | #231 | Tragic 35.0% |
| Hmong | 3.4 /100 | #232 | Tragic 34.8% |