Mongolian vs Immigrants from Burma/Myanmar Bachelor's Degree
COMPARE
Mongolian
Immigrants from Burma/Myanmar
Bachelor's Degree
Bachelor's Degree Comparison
Mongolians
Immigrants from Burma/Myanmar
45.4%
BACHELOR'S DEGREE
100.0/ 100
METRIC RATING
36th/ 347
METRIC RANK
35.5%
BACHELOR'S DEGREE
7.3/ 100
METRIC RATING
225th/ 347
METRIC RANK
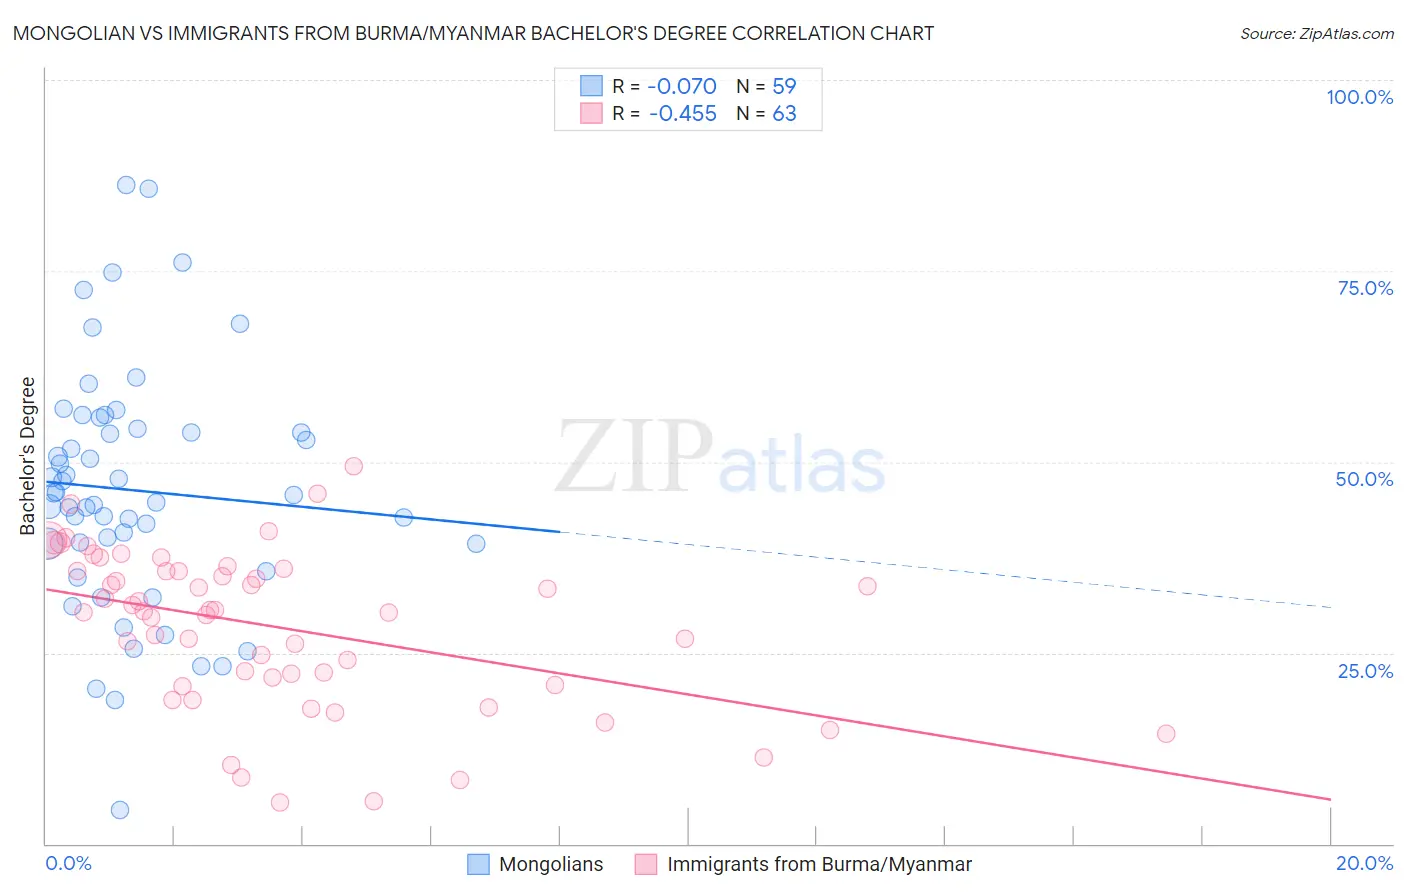
Mongolian vs Immigrants from Burma/Myanmar Bachelor's Degree Correlation Chart
The statistical analysis conducted on geographies consisting of 140,357,131 people shows a slight negative correlation between the proportion of Mongolians and percentage of population with at least bachelor's degree education in the United States with a correlation coefficient (R) of -0.070 and weighted average of 45.4%. Similarly, the statistical analysis conducted on geographies consisting of 172,337,344 people shows a moderate negative correlation between the proportion of Immigrants from Burma/Myanmar and percentage of population with at least bachelor's degree education in the United States with a correlation coefficient (R) of -0.455 and weighted average of 35.5%, a difference of 27.9%.
Bachelor's Degree Correlation Summary
| Measurement | Mongolian | Immigrants from Burma/Myanmar |
| Minimum | 4.5% | 5.5% |
| Maximum | 86.2% | 49.5% |
| Range | 81.7% | 44.0% |
| Mean | 46.3% | 28.4% |
| Median | 45.7% | 30.5% |
| Interquartile 25% (IQ1) | 39.2% | 20.8% |
| Interquartile 75% (IQ3) | 54.3% | 35.8% |
| Interquartile Range (IQR) | 15.0% | 15.0% |
| Standard Deviation (Sample) | 15.9% | 10.3% |
| Standard Deviation (Population) | 15.8% | 10.2% |
Similar Demographics by Bachelor's Degree
Demographics Similar to Mongolians by Bachelor's Degree
In terms of bachelor's degree, the demographic groups most similar to Mongolians are Immigrants from Russia (45.4%, a difference of 0.020%), Immigrants from Denmark (45.4%, a difference of 0.040%), Russian (45.3%, a difference of 0.15%), Bulgarian (45.3%, a difference of 0.24%), and Immigrants from Northern Europe (45.6%, a difference of 0.50%).
| Demographics | Rating | Rank | Bachelor's Degree |
| Israelis | 100.0 /100 | #29 | Exceptional 46.1% |
| Immigrants | Sri Lanka | 100.0 /100 | #30 | Exceptional 46.1% |
| Latvians | 100.0 /100 | #31 | Exceptional 46.1% |
| Immigrants | Turkey | 100.0 /100 | #32 | Exceptional 46.0% |
| Immigrants | Northern Europe | 100.0 /100 | #33 | Exceptional 45.6% |
| Immigrants | Denmark | 100.0 /100 | #34 | Exceptional 45.4% |
| Immigrants | Russia | 100.0 /100 | #35 | Exceptional 45.4% |
| Mongolians | 100.0 /100 | #36 | Exceptional 45.4% |
| Russians | 100.0 /100 | #37 | Exceptional 45.3% |
| Bulgarians | 100.0 /100 | #38 | Exceptional 45.3% |
| Immigrants | Latvia | 100.0 /100 | #39 | Exceptional 45.1% |
| Immigrants | Belarus | 100.0 /100 | #40 | Exceptional 45.0% |
| Immigrants | Malaysia | 100.0 /100 | #41 | Exceptional 45.0% |
| Immigrants | Saudi Arabia | 100.0 /100 | #42 | Exceptional 44.8% |
| Immigrants | South Africa | 99.9 /100 | #43 | Exceptional 44.8% |
Demographics Similar to Immigrants from Burma/Myanmar by Bachelor's Degree
In terms of bachelor's degree, the demographic groups most similar to Immigrants from Burma/Myanmar are Portuguese (35.5%, a difference of 0.040%), Immigrants from Barbados (35.5%, a difference of 0.070%), Ecuadorian (35.4%, a difference of 0.30%), French Canadian (35.6%, a difference of 0.35%), and Trinidadian and Tobagonian (35.7%, a difference of 0.52%).
| Demographics | Rating | Rank | Bachelor's Degree |
| Sub-Saharan Africans | 9.8 /100 | #218 | Tragic 35.8% |
| West Indians | 9.7 /100 | #219 | Tragic 35.8% |
| Spanish | 9.6 /100 | #220 | Tragic 35.8% |
| Dutch | 9.2 /100 | #221 | Tragic 35.7% |
| Trinidadians and Tobagonians | 8.8 /100 | #222 | Tragic 35.7% |
| French Canadians | 8.3 /100 | #223 | Tragic 35.6% |
| Immigrants | Barbados | 7.5 /100 | #224 | Tragic 35.5% |
| Immigrants | Burma/Myanmar | 7.3 /100 | #225 | Tragic 35.5% |
| Portuguese | 7.2 /100 | #226 | Tragic 35.5% |
| Ecuadorians | 6.6 /100 | #227 | Tragic 35.4% |
| Immigrants | Trinidad and Tobago | 6.0 /100 | #228 | Tragic 35.3% |
| Whites/Caucasians | 5.9 /100 | #229 | Tragic 35.3% |
| Immigrants | Grenada | 4.3 /100 | #230 | Tragic 35.0% |
| Immigrants | St. Vincent and the Grenadines | 4.3 /100 | #231 | Tragic 35.0% |
| Hmong | 3.4 /100 | #232 | Tragic 34.8% |