Immigrants from Belgium vs Immigrants from Burma/Myanmar Bachelor's Degree
COMPARE
Immigrants from Belgium
Immigrants from Burma/Myanmar
Bachelor's Degree
Bachelor's Degree Comparison
Immigrants from Belgium
Immigrants from Burma/Myanmar
47.0%
BACHELOR'S DEGREE
100.0/ 100
METRIC RATING
22nd/ 347
METRIC RANK
35.5%
BACHELOR'S DEGREE
7.3/ 100
METRIC RATING
225th/ 347
METRIC RANK
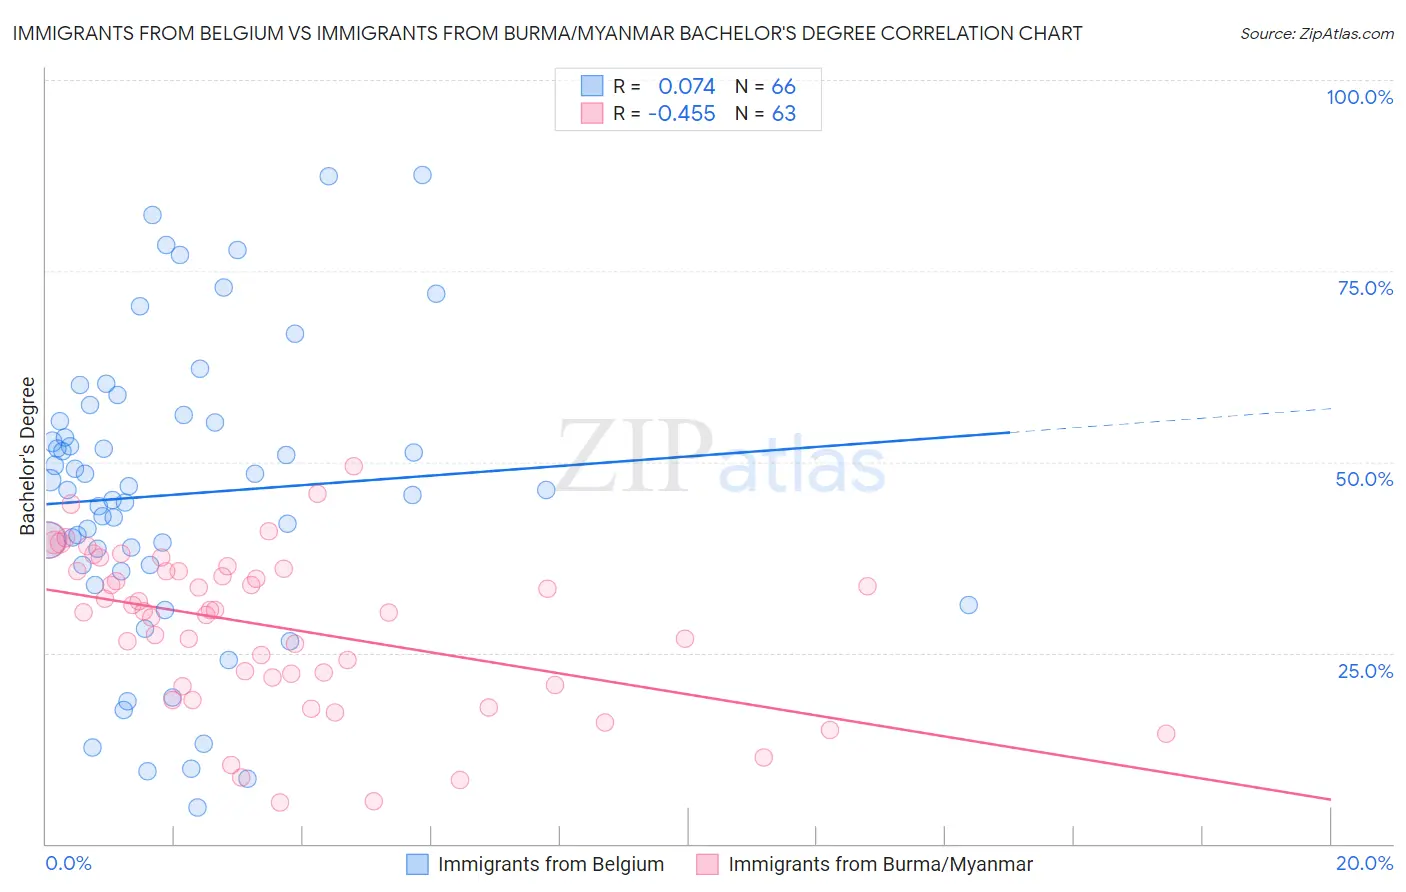
Immigrants from Belgium vs Immigrants from Burma/Myanmar Bachelor's Degree Correlation Chart
The statistical analysis conducted on geographies consisting of 146,728,237 people shows a slight positive correlation between the proportion of Immigrants from Belgium and percentage of population with at least bachelor's degree education in the United States with a correlation coefficient (R) of 0.074 and weighted average of 47.0%. Similarly, the statistical analysis conducted on geographies consisting of 172,337,344 people shows a moderate negative correlation between the proportion of Immigrants from Burma/Myanmar and percentage of population with at least bachelor's degree education in the United States with a correlation coefficient (R) of -0.455 and weighted average of 35.5%, a difference of 32.5%.
Bachelor's Degree Correlation Summary
| Measurement | Immigrants from Belgium | Immigrants from Burma/Myanmar |
| Minimum | 4.8% | 5.5% |
| Maximum | 87.6% | 49.5% |
| Range | 82.8% | 44.0% |
| Mean | 45.7% | 28.4% |
| Median | 46.3% | 30.5% |
| Interquartile 25% (IQ1) | 36.5% | 20.8% |
| Interquartile 75% (IQ3) | 55.4% | 35.8% |
| Interquartile Range (IQR) | 18.9% | 15.0% |
| Standard Deviation (Sample) | 19.4% | 10.3% |
| Standard Deviation (Population) | 19.2% | 10.2% |
Similar Demographics by Bachelor's Degree
Demographics Similar to Immigrants from Belgium by Bachelor's Degree
In terms of bachelor's degree, the demographic groups most similar to Immigrants from Belgium are Immigrants from Sweden (47.0%, a difference of 0.090%), Immigrants from Korea (47.0%, a difference of 0.13%), Immigrants from Ireland (47.1%, a difference of 0.20%), Immigrants from Switzerland (47.1%, a difference of 0.21%), and Burmese (46.9%, a difference of 0.35%).
| Demographics | Rating | Rank | Bachelor's Degree |
| Immigrants | Eastern Asia | 100.0 /100 | #15 | Exceptional 48.1% |
| Soviet Union | 100.0 /100 | #16 | Exceptional 47.9% |
| Eastern Europeans | 100.0 /100 | #17 | Exceptional 47.5% |
| Indians (Asian) | 100.0 /100 | #18 | Exceptional 47.4% |
| Cambodians | 100.0 /100 | #19 | Exceptional 47.2% |
| Immigrants | Switzerland | 100.0 /100 | #20 | Exceptional 47.1% |
| Immigrants | Ireland | 100.0 /100 | #21 | Exceptional 47.1% |
| Immigrants | Belgium | 100.0 /100 | #22 | Exceptional 47.0% |
| Immigrants | Sweden | 100.0 /100 | #23 | Exceptional 47.0% |
| Immigrants | Korea | 100.0 /100 | #24 | Exceptional 47.0% |
| Burmese | 100.0 /100 | #25 | Exceptional 46.9% |
| Immigrants | Japan | 100.0 /100 | #26 | Exceptional 46.8% |
| Immigrants | France | 100.0 /100 | #27 | Exceptional 46.4% |
| Turks | 100.0 /100 | #28 | Exceptional 46.2% |
| Israelis | 100.0 /100 | #29 | Exceptional 46.1% |
Demographics Similar to Immigrants from Burma/Myanmar by Bachelor's Degree
In terms of bachelor's degree, the demographic groups most similar to Immigrants from Burma/Myanmar are Portuguese (35.5%, a difference of 0.040%), Immigrants from Barbados (35.5%, a difference of 0.070%), Ecuadorian (35.4%, a difference of 0.30%), French Canadian (35.6%, a difference of 0.35%), and Trinidadian and Tobagonian (35.7%, a difference of 0.52%).
| Demographics | Rating | Rank | Bachelor's Degree |
| Sub-Saharan Africans | 9.8 /100 | #218 | Tragic 35.8% |
| West Indians | 9.7 /100 | #219 | Tragic 35.8% |
| Spanish | 9.6 /100 | #220 | Tragic 35.8% |
| Dutch | 9.2 /100 | #221 | Tragic 35.7% |
| Trinidadians and Tobagonians | 8.8 /100 | #222 | Tragic 35.7% |
| French Canadians | 8.3 /100 | #223 | Tragic 35.6% |
| Immigrants | Barbados | 7.5 /100 | #224 | Tragic 35.5% |
| Immigrants | Burma/Myanmar | 7.3 /100 | #225 | Tragic 35.5% |
| Portuguese | 7.2 /100 | #226 | Tragic 35.5% |
| Ecuadorians | 6.6 /100 | #227 | Tragic 35.4% |
| Immigrants | Trinidad and Tobago | 6.0 /100 | #228 | Tragic 35.3% |
| Whites/Caucasians | 5.9 /100 | #229 | Tragic 35.3% |
| Immigrants | Grenada | 4.3 /100 | #230 | Tragic 35.0% |
| Immigrants | St. Vincent and the Grenadines | 4.3 /100 | #231 | Tragic 35.0% |
| Hmong | 3.4 /100 | #232 | Tragic 34.8% |