Iranian vs Japanese 11th Grade
COMPARE
Iranian
Japanese
11th Grade
11th Grade Comparison
Iranians
Japanese
94.0%
11TH GRADE
99.9/ 100
METRIC RATING
58th/ 347
METRIC RANK
89.9%
11TH GRADE
0.0/ 100
METRIC RATING
299th/ 347
METRIC RANK
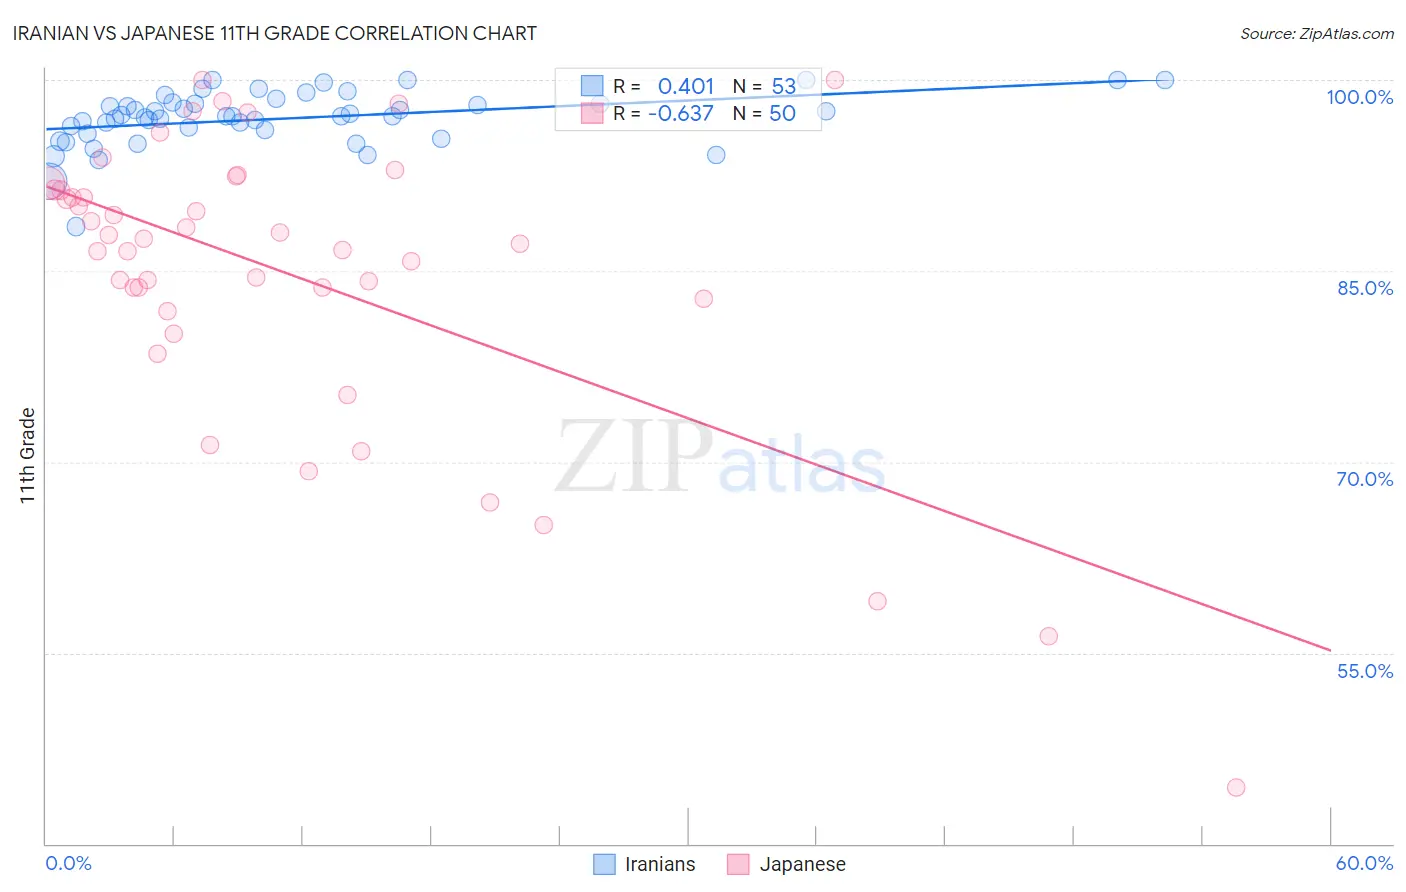
Iranian vs Japanese 11th Grade Correlation Chart
The statistical analysis conducted on geographies consisting of 316,901,778 people shows a moderate positive correlation between the proportion of Iranians and percentage of population with at least 11th grade education in the United States with a correlation coefficient (R) of 0.401 and weighted average of 94.0%. Similarly, the statistical analysis conducted on geographies consisting of 249,183,224 people shows a significant negative correlation between the proportion of Japanese and percentage of population with at least 11th grade education in the United States with a correlation coefficient (R) of -0.637 and weighted average of 89.9%, a difference of 4.5%.
11th Grade Correlation Summary
| Measurement | Iranian | Japanese |
| Minimum | 88.5% | 44.4% |
| Maximum | 100.0% | 100.0% |
| Range | 11.5% | 55.6% |
| Mean | 97.0% | 84.8% |
| Median | 97.2% | 87.3% |
| Interquartile 25% (IQ1) | 96.0% | 82.8% |
| Interquartile 75% (IQ3) | 98.2% | 91.4% |
| Interquartile Range (IQR) | 2.3% | 8.6% |
| Standard Deviation (Sample) | 2.2% | 11.5% |
| Standard Deviation (Population) | 2.2% | 11.4% |
Similar Demographics by 11th Grade
Demographics Similar to Iranians by 11th Grade
In terms of 11th grade, the demographic groups most similar to Iranians are French Canadian (94.0%, a difference of 0.0%), New Zealander (94.0%, a difference of 0.0%), Bhutanese (94.0%, a difference of 0.0%), Okinawan (94.0%, a difference of 0.0%), and Immigrants from North America (94.0%, a difference of 0.010%).
| Demographics | Rating | Rank | 11th Grade |
| Turks | 99.9 /100 | #51 | Exceptional 94.0% |
| Immigrants | Canada | 99.9 /100 | #52 | Exceptional 94.0% |
| Immigrants | Australia | 99.9 /100 | #53 | Exceptional 94.0% |
| Immigrants | North America | 99.9 /100 | #54 | Exceptional 94.0% |
| Czechoslovakians | 99.9 /100 | #55 | Exceptional 94.0% |
| French Canadians | 99.9 /100 | #56 | Exceptional 94.0% |
| New Zealanders | 99.9 /100 | #57 | Exceptional 94.0% |
| Iranians | 99.9 /100 | #58 | Exceptional 94.0% |
| Bhutanese | 99.8 /100 | #59 | Exceptional 94.0% |
| Okinawans | 99.8 /100 | #60 | Exceptional 94.0% |
| Immigrants | Belgium | 99.8 /100 | #61 | Exceptional 94.0% |
| Austrians | 99.8 /100 | #62 | Exceptional 94.0% |
| Ukrainians | 99.8 /100 | #63 | Exceptional 94.0% |
| Immigrants | Sweden | 99.8 /100 | #64 | Exceptional 93.9% |
| Native Hawaiians | 99.8 /100 | #65 | Exceptional 93.9% |
Demographics Similar to Japanese by 11th Grade
In terms of 11th grade, the demographic groups most similar to Japanese are Immigrants from Haiti (89.9%, a difference of 0.010%), Guyanese (89.9%, a difference of 0.020%), Immigrants from Fiji (89.9%, a difference of 0.030%), Navajo (90.0%, a difference of 0.10%), and Fijian (90.0%, a difference of 0.14%).
| Demographics | Rating | Rank | 11th Grade |
| Cubans | 0.0 /100 | #292 | Tragic 90.2% |
| Natives/Alaskans | 0.0 /100 | #293 | Tragic 90.2% |
| Immigrants | Grenada | 0.0 /100 | #294 | Tragic 90.1% |
| Immigrants | Vietnam | 0.0 /100 | #295 | Tragic 90.0% |
| Fijians | 0.0 /100 | #296 | Tragic 90.0% |
| Navajo | 0.0 /100 | #297 | Tragic 90.0% |
| Immigrants | Fiji | 0.0 /100 | #298 | Tragic 89.9% |
| Japanese | 0.0 /100 | #299 | Tragic 89.9% |
| Immigrants | Haiti | 0.0 /100 | #300 | Tragic 89.9% |
| Guyanese | 0.0 /100 | #301 | Tragic 89.9% |
| Immigrants | Guyana | 0.0 /100 | #302 | Tragic 89.7% |
| Immigrants | Immigrants | 0.0 /100 | #303 | Tragic 89.7% |
| Yuman | 0.0 /100 | #304 | Tragic 89.7% |
| Immigrants | Cambodia | 0.0 /100 | #305 | Tragic 89.6% |
| Ecuadorians | 0.0 /100 | #306 | Tragic 89.6% |