Iranian vs Immigrants from Spain 11th Grade
COMPARE
Iranian
Immigrants from Spain
11th Grade
11th Grade Comparison
Iranians
Immigrants from Spain
94.0%
11TH GRADE
99.9/ 100
METRIC RATING
58th/ 347
METRIC RANK
92.7%
11TH GRADE
73.0/ 100
METRIC RATING
156th/ 347
METRIC RANK
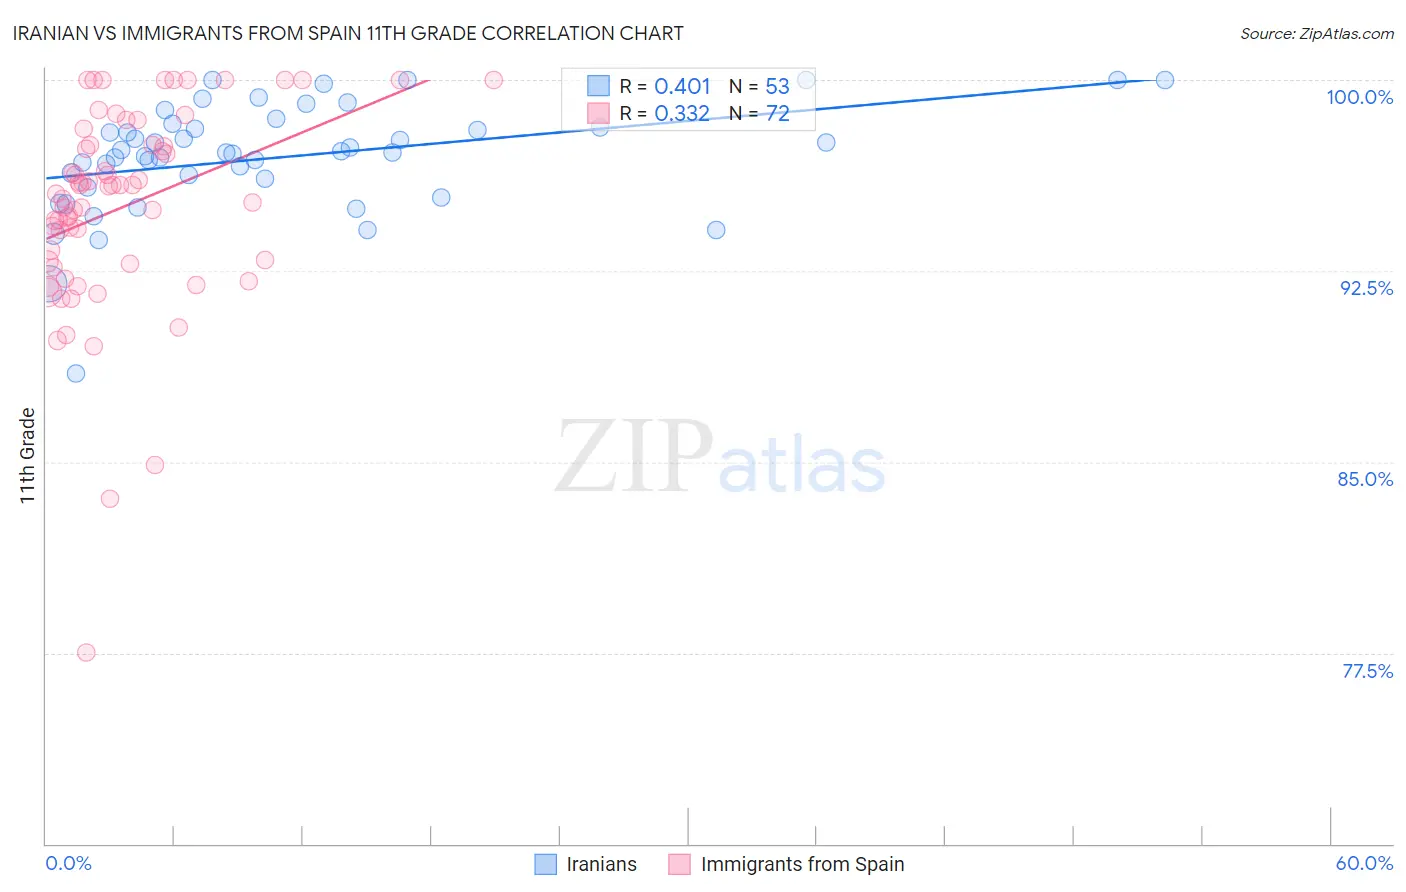
Iranian vs Immigrants from Spain 11th Grade Correlation Chart
The statistical analysis conducted on geographies consisting of 316,901,778 people shows a moderate positive correlation between the proportion of Iranians and percentage of population with at least 11th grade education in the United States with a correlation coefficient (R) of 0.401 and weighted average of 94.0%. Similarly, the statistical analysis conducted on geographies consisting of 239,682,725 people shows a mild positive correlation between the proportion of Immigrants from Spain and percentage of population with at least 11th grade education in the United States with a correlation coefficient (R) of 0.332 and weighted average of 92.7%, a difference of 1.3%.
11th Grade Correlation Summary
| Measurement | Iranian | Immigrants from Spain |
| Minimum | 88.5% | 77.5% |
| Maximum | 100.0% | 100.0% |
| Range | 11.5% | 22.5% |
| Mean | 97.0% | 95.0% |
| Median | 97.2% | 95.7% |
| Interquartile 25% (IQ1) | 96.0% | 92.8% |
| Interquartile 75% (IQ3) | 98.2% | 97.4% |
| Interquartile Range (IQR) | 2.3% | 4.6% |
| Standard Deviation (Sample) | 2.2% | 4.0% |
| Standard Deviation (Population) | 2.2% | 4.0% |
Similar Demographics by 11th Grade
Demographics Similar to Iranians by 11th Grade
In terms of 11th grade, the demographic groups most similar to Iranians are French Canadian (94.0%, a difference of 0.0%), New Zealander (94.0%, a difference of 0.0%), Bhutanese (94.0%, a difference of 0.0%), Okinawan (94.0%, a difference of 0.0%), and Immigrants from North America (94.0%, a difference of 0.010%).
| Demographics | Rating | Rank | 11th Grade |
| Turks | 99.9 /100 | #51 | Exceptional 94.0% |
| Immigrants | Canada | 99.9 /100 | #52 | Exceptional 94.0% |
| Immigrants | Australia | 99.9 /100 | #53 | Exceptional 94.0% |
| Immigrants | North America | 99.9 /100 | #54 | Exceptional 94.0% |
| Czechoslovakians | 99.9 /100 | #55 | Exceptional 94.0% |
| French Canadians | 99.9 /100 | #56 | Exceptional 94.0% |
| New Zealanders | 99.9 /100 | #57 | Exceptional 94.0% |
| Iranians | 99.9 /100 | #58 | Exceptional 94.0% |
| Bhutanese | 99.8 /100 | #59 | Exceptional 94.0% |
| Okinawans | 99.8 /100 | #60 | Exceptional 94.0% |
| Immigrants | Belgium | 99.8 /100 | #61 | Exceptional 94.0% |
| Austrians | 99.8 /100 | #62 | Exceptional 94.0% |
| Ukrainians | 99.8 /100 | #63 | Exceptional 94.0% |
| Immigrants | Sweden | 99.8 /100 | #64 | Exceptional 93.9% |
| Native Hawaiians | 99.8 /100 | #65 | Exceptional 93.9% |
Demographics Similar to Immigrants from Spain by 11th Grade
In terms of 11th grade, the demographic groups most similar to Immigrants from Spain are Osage (92.7%, a difference of 0.0%), Argentinean (92.7%, a difference of 0.0%), Immigrants from Eastern Asia (92.7%, a difference of 0.0%), Brazilian (92.8%, a difference of 0.010%), and Immigrants from Venezuela (92.7%, a difference of 0.010%).
| Demographics | Rating | Rank | 11th Grade |
| Immigrants | Poland | 78.5 /100 | #149 | Good 92.8% |
| Immigrants | Egypt | 77.5 /100 | #150 | Good 92.8% |
| Potawatomi | 74.3 /100 | #151 | Good 92.8% |
| Iraqis | 74.2 /100 | #152 | Good 92.8% |
| Brazilians | 73.9 /100 | #153 | Good 92.8% |
| Osage | 73.4 /100 | #154 | Good 92.7% |
| Argentineans | 73.4 /100 | #155 | Good 92.7% |
| Immigrants | Spain | 73.0 /100 | #156 | Good 92.7% |
| Immigrants | Eastern Asia | 72.6 /100 | #157 | Good 92.7% |
| Immigrants | Venezuela | 72.0 /100 | #158 | Good 92.7% |
| Americans | 71.7 /100 | #159 | Good 92.7% |
| Immigrants | Lebanon | 70.7 /100 | #160 | Good 92.7% |
| Immigrants | Argentina | 69.8 /100 | #161 | Good 92.7% |
| Paraguayans | 68.7 /100 | #162 | Good 92.7% |
| Immigrants | Nonimmigrants | 66.6 /100 | #163 | Good 92.7% |