Alaskan Athabascan vs Yakama 11th Grade
COMPARE
Alaskan Athabascan
Yakama
11th Grade
11th Grade Comparison
Alaskan Athabascans
Yakama
93.9%
11TH GRADE
99.8/ 100
METRIC RATING
66th/ 347
METRIC RANK
85.0%
11TH GRADE
0.0/ 100
METRIC RATING
344th/ 347
METRIC RANK
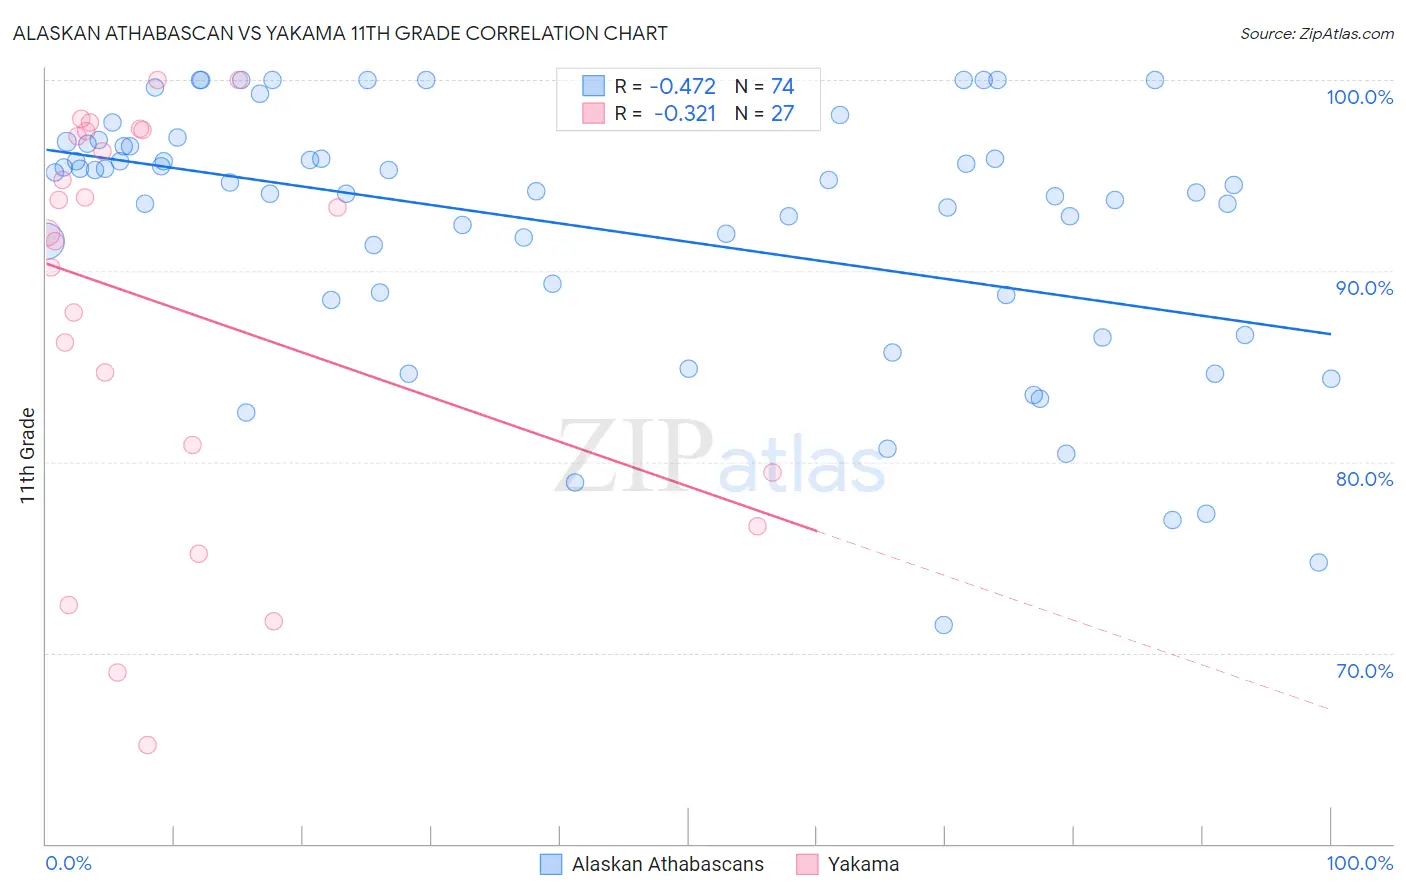
Alaskan Athabascan vs Yakama 11th Grade Correlation Chart
The statistical analysis conducted on geographies consisting of 45,820,226 people shows a moderate negative correlation between the proportion of Alaskan Athabascans and percentage of population with at least 11th grade education in the United States with a correlation coefficient (R) of -0.472 and weighted average of 93.9%. Similarly, the statistical analysis conducted on geographies consisting of 19,923,144 people shows a mild negative correlation between the proportion of Yakama and percentage of population with at least 11th grade education in the United States with a correlation coefficient (R) of -0.321 and weighted average of 85.0%, a difference of 10.5%.
11th Grade Correlation Summary
| Measurement | Alaskan Athabascan | Yakama |
| Minimum | 71.4% | 65.2% |
| Maximum | 100.0% | 100.0% |
| Range | 28.6% | 34.8% |
| Mean | 92.3% | 88.1% |
| Median | 94.3% | 92.0% |
| Interquartile 25% (IQ1) | 88.7% | 79.5% |
| Interquartile 75% (IQ3) | 96.5% | 97.3% |
| Interquartile Range (IQR) | 7.8% | 17.9% |
| Standard Deviation (Sample) | 6.8% | 10.5% |
| Standard Deviation (Population) | 6.7% | 10.3% |
Similar Demographics by 11th Grade
Demographics Similar to Alaskan Athabascans by 11th Grade
In terms of 11th grade, the demographic groups most similar to Alaskan Athabascans are Immigrants from Netherlands (93.9%, a difference of 0.0%), Immigrants from Sweden (93.9%, a difference of 0.020%), Native Hawaiian (93.9%, a difference of 0.020%), Zimbabwean (93.9%, a difference of 0.020%), and Scotch-Irish (93.9%, a difference of 0.020%).
| Demographics | Rating | Rank | 11th Grade |
| Bhutanese | 99.8 /100 | #59 | Exceptional 94.0% |
| Okinawans | 99.8 /100 | #60 | Exceptional 94.0% |
| Immigrants | Belgium | 99.8 /100 | #61 | Exceptional 94.0% |
| Austrians | 99.8 /100 | #62 | Exceptional 94.0% |
| Ukrainians | 99.8 /100 | #63 | Exceptional 94.0% |
| Immigrants | Sweden | 99.8 /100 | #64 | Exceptional 93.9% |
| Native Hawaiians | 99.8 /100 | #65 | Exceptional 93.9% |
| Alaskan Athabascans | 99.8 /100 | #66 | Exceptional 93.9% |
| Immigrants | Netherlands | 99.8 /100 | #67 | Exceptional 93.9% |
| Zimbabweans | 99.8 /100 | #68 | Exceptional 93.9% |
| Scotch-Irish | 99.8 /100 | #69 | Exceptional 93.9% |
| Immigrants | England | 99.7 /100 | #70 | Exceptional 93.8% |
| Immigrants | South Africa | 99.7 /100 | #71 | Exceptional 93.8% |
| Immigrants | Japan | 99.7 /100 | #72 | Exceptional 93.8% |
| Romanians | 99.6 /100 | #73 | Exceptional 93.8% |
Demographics Similar to Yakama by 11th Grade
In terms of 11th grade, the demographic groups most similar to Yakama are Immigrants from Central America (84.9%, a difference of 0.030%), Spanish American Indian (84.7%, a difference of 0.27%), Immigrants from El Salvador (85.3%, a difference of 0.40%), Immigrants from Mexico (84.5%, a difference of 0.57%), and Immigrants from Guatemala (85.8%, a difference of 1.0%).
| Demographics | Rating | Rank | 11th Grade |
| Immigrants | Yemen | 0.0 /100 | #333 | Tragic 87.1% |
| Houma | 0.0 /100 | #334 | Tragic 87.0% |
| Central Americans | 0.0 /100 | #335 | Tragic 86.9% |
| Immigrants | Dominican Republic | 0.0 /100 | #336 | Tragic 86.9% |
| Immigrants | Honduras | 0.0 /100 | #337 | Tragic 86.9% |
| Immigrants | Latin America | 0.0 /100 | #338 | Tragic 86.8% |
| Guatemalans | 0.0 /100 | #339 | Tragic 86.4% |
| Salvadorans | 0.0 /100 | #340 | Tragic 86.2% |
| Mexicans | 0.0 /100 | #341 | Tragic 86.1% |
| Immigrants | Guatemala | 0.0 /100 | #342 | Tragic 85.8% |
| Immigrants | El Salvador | 0.0 /100 | #343 | Tragic 85.3% |
| Yakama | 0.0 /100 | #344 | Tragic 85.0% |
| Immigrants | Central America | 0.0 /100 | #345 | Tragic 84.9% |
| Spanish American Indians | 0.0 /100 | #346 | Tragic 84.7% |
| Immigrants | Mexico | 0.0 /100 | #347 | Tragic 84.5% |