Iranian vs Immigrants from Portugal 5th Grade
COMPARE
Iranian
Immigrants from Portugal
5th Grade
5th Grade Comparison
Iranians
Immigrants from Portugal
97.9%
5TH GRADE
99.5/ 100
METRIC RATING
70th/ 347
METRIC RANK
95.9%
5TH GRADE
0.0/ 100
METRIC RATING
314th/ 347
METRIC RANK
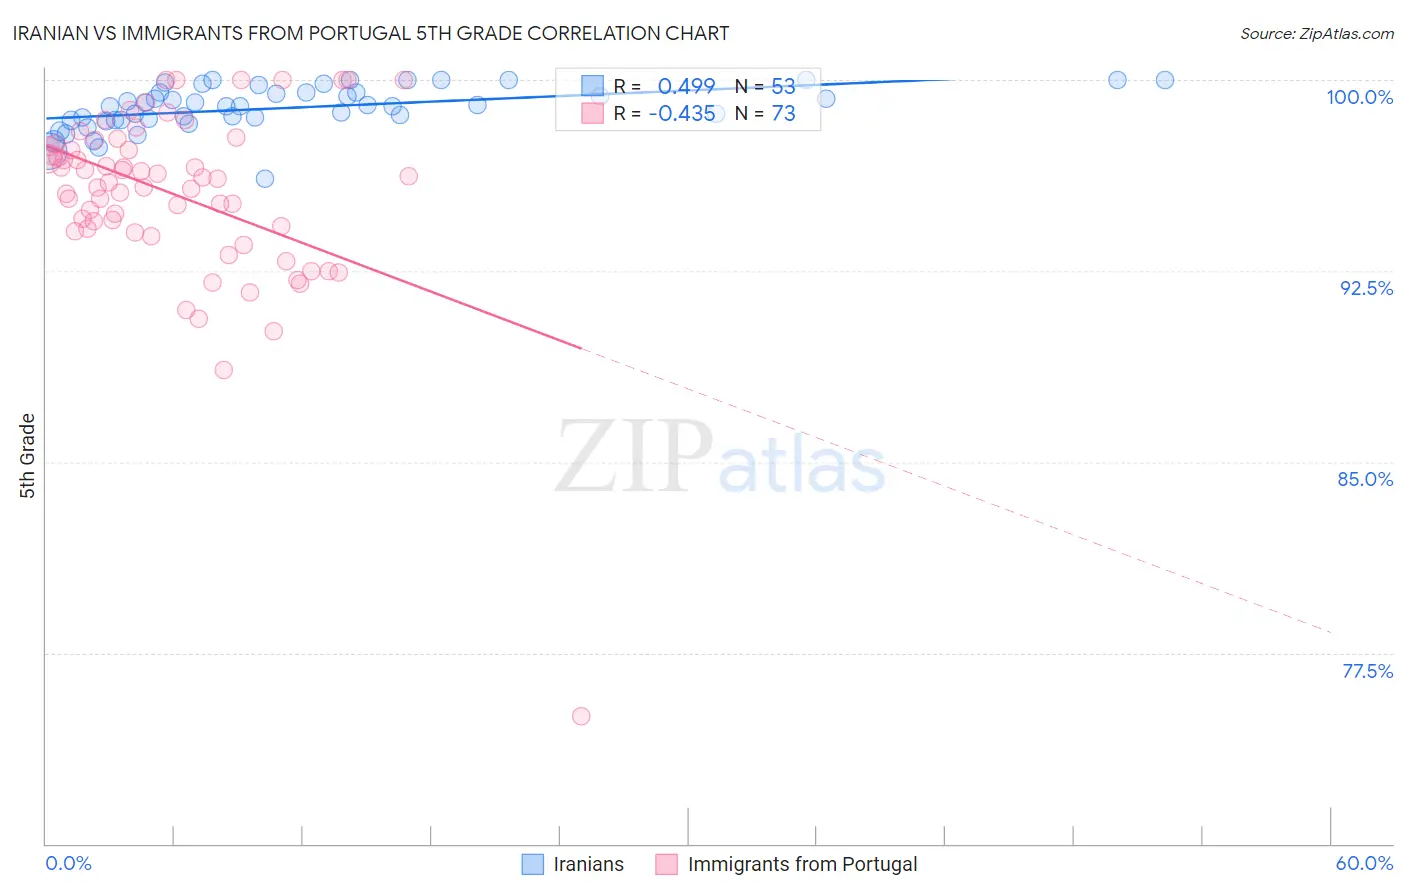
Iranian vs Immigrants from Portugal 5th Grade Correlation Chart
The statistical analysis conducted on geographies consisting of 310,636,461 people shows a moderate positive correlation between the proportion of Iranians and percentage of population with at least 5th grade education in the United States with a correlation coefficient (R) of 0.499 and weighted average of 97.9%. Similarly, the statistical analysis conducted on geographies consisting of 174,792,107 people shows a moderate negative correlation between the proportion of Immigrants from Portugal and percentage of population with at least 5th grade education in the United States with a correlation coefficient (R) of -0.435 and weighted average of 95.9%, a difference of 2.0%.
5th Grade Correlation Summary
| Measurement | Iranian | Immigrants from Portugal |
| Minimum | 96.1% | 75.0% |
| Maximum | 100.0% | 100.0% |
| Range | 3.9% | 25.0% |
| Mean | 98.9% | 95.5% |
| Median | 99.0% | 96.1% |
| Interquartile 25% (IQ1) | 98.4% | 94.1% |
| Interquartile 75% (IQ3) | 99.5% | 97.5% |
| Interquartile Range (IQR) | 1.1% | 3.4% |
| Standard Deviation (Sample) | 0.86% | 3.5% |
| Standard Deviation (Population) | 0.85% | 3.5% |
Similar Demographics by 5th Grade
Demographics Similar to Iranians by 5th Grade
In terms of 5th grade, the demographic groups most similar to Iranians are Chickasaw (97.9%, a difference of 0.0%), Kiowa (97.9%, a difference of 0.010%), Macedonian (97.9%, a difference of 0.010%), Cajun (97.9%, a difference of 0.020%), and Cherokee (97.8%, a difference of 0.020%).
| Demographics | Rating | Rank | 5th Grade |
| Russians | 99.7 /100 | #63 | Exceptional 97.9% |
| Immigrants | Northern Europe | 99.6 /100 | #64 | Exceptional 97.9% |
| Canadians | 99.6 /100 | #65 | Exceptional 97.9% |
| Immigrants | Austria | 99.6 /100 | #66 | Exceptional 97.9% |
| New Zealanders | 99.6 /100 | #67 | Exceptional 97.9% |
| Cajuns | 99.6 /100 | #68 | Exceptional 97.9% |
| Kiowa | 99.5 /100 | #69 | Exceptional 97.9% |
| Iranians | 99.5 /100 | #70 | Exceptional 97.9% |
| Chickasaw | 99.5 /100 | #71 | Exceptional 97.9% |
| Macedonians | 99.4 /100 | #72 | Exceptional 97.9% |
| Cherokee | 99.4 /100 | #73 | Exceptional 97.8% |
| Lumbee | 99.3 /100 | #74 | Exceptional 97.8% |
| Ukrainians | 99.3 /100 | #75 | Exceptional 97.8% |
| Immigrants | Netherlands | 99.3 /100 | #76 | Exceptional 97.8% |
| Immigrants | England | 99.3 /100 | #77 | Exceptional 97.8% |
Demographics Similar to Immigrants from Portugal by 5th Grade
In terms of 5th grade, the demographic groups most similar to Immigrants from Portugal are Bangladeshi (95.9%, a difference of 0.0%), Vietnamese (95.9%, a difference of 0.020%), Nicaraguan (95.9%, a difference of 0.020%), Immigrants from Bangladesh (96.0%, a difference of 0.050%), and Indonesian (96.0%, a difference of 0.070%).
| Demographics | Rating | Rank | 5th Grade |
| Immigrants | Caribbean | 0.0 /100 | #307 | Tragic 96.0% |
| Ecuadorians | 0.0 /100 | #308 | Tragic 96.0% |
| Immigrants | Guyana | 0.0 /100 | #309 | Tragic 96.0% |
| Indonesians | 0.0 /100 | #310 | Tragic 96.0% |
| Immigrants | Bangladesh | 0.0 /100 | #311 | Tragic 96.0% |
| Vietnamese | 0.0 /100 | #312 | Tragic 95.9% |
| Bangladeshis | 0.0 /100 | #313 | Tragic 95.9% |
| Immigrants | Portugal | 0.0 /100 | #314 | Tragic 95.9% |
| Nicaraguans | 0.0 /100 | #315 | Tragic 95.9% |
| Immigrants | Ecuador | 0.0 /100 | #316 | Tragic 95.8% |
| Belizeans | 0.0 /100 | #317 | Tragic 95.8% |
| Immigrants | Vietnam | 0.0 /100 | #318 | Tragic 95.8% |
| Japanese | 0.0 /100 | #319 | Tragic 95.7% |
| Central American Indians | 0.0 /100 | #320 | Tragic 95.7% |
| Immigrants | Belize | 0.0 /100 | #321 | Tragic 95.7% |