Iranian vs Immigrants from Kuwait Per Capita Income
COMPARE
Iranian
Immigrants from Kuwait
Per Capita Income
Per Capita Income Comparison
Iranians
Immigrants from Kuwait
$58,786
PER CAPITA INCOME
100.0/ 100
METRIC RATING
2nd/ 347
METRIC RANK
$46,543
PER CAPITA INCOME
96.2/ 100
METRIC RATING
108th/ 347
METRIC RANK
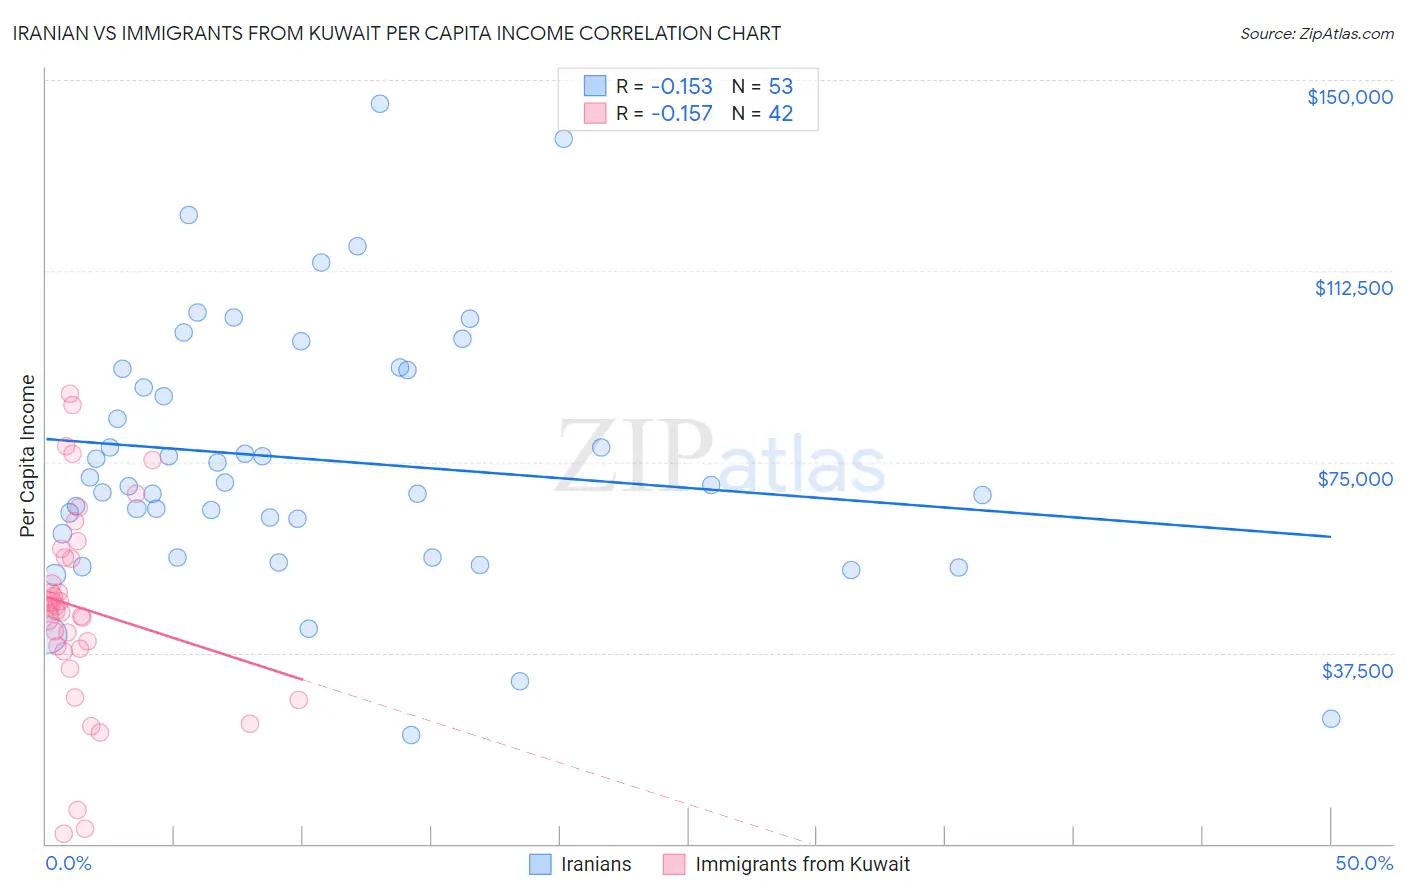
Iranian vs Immigrants from Kuwait Per Capita Income Correlation Chart
The statistical analysis conducted on geographies consisting of 316,916,136 people shows a poor negative correlation between the proportion of Iranians and per capita income in the United States with a correlation coefficient (R) of -0.153 and weighted average of $58,786. Similarly, the statistical analysis conducted on geographies consisting of 136,913,885 people shows a poor negative correlation between the proportion of Immigrants from Kuwait and per capita income in the United States with a correlation coefficient (R) of -0.157 and weighted average of $46,543, a difference of 26.3%.
Per Capita Income Correlation Summary
| Measurement | Iranian | Immigrants from Kuwait |
| Minimum | $21,346 | $2,068 |
| Maximum | $145,312 | $88,433 |
| Range | $123,966 | $86,365 |
| Mean | $75,439 | $46,335 |
| Median | $70,507 | $46,027 |
| Interquartile 25% (IQ1) | $58,523 | $38,209 |
| Interquartile 75% (IQ3) | $93,126 | $56,277 |
| Interquartile Range (IQR) | $34,604 | $18,068 |
| Standard Deviation (Sample) | $25,681 | $19,760 |
| Standard Deviation (Population) | $25,438 | $19,524 |
Similar Demographics by Per Capita Income
Demographics Similar to Iranians by Per Capita Income
In terms of per capita income, the demographic groups most similar to Iranians are Filipino ($59,066, a difference of 0.48%), Immigrants from Singapore ($58,353, a difference of 0.74%), Immigrants from Australia ($57,953, a difference of 1.4%), Immigrants from Iran ($57,759, a difference of 1.8%), and Immigrants from Taiwan ($57,742, a difference of 1.8%).
| Demographics | Rating | Rank | Per Capita Income |
| Filipinos | 100.0 /100 | #1 | Exceptional $59,066 |
| Iranians | 100.0 /100 | #2 | Exceptional $58,786 |
| Immigrants | Singapore | 100.0 /100 | #3 | Exceptional $58,353 |
| Immigrants | Australia | 100.0 /100 | #4 | Exceptional $57,953 |
| Immigrants | Iran | 100.0 /100 | #5 | Exceptional $57,759 |
| Immigrants | Taiwan | 100.0 /100 | #6 | Exceptional $57,742 |
| Immigrants | Israel | 100.0 /100 | #7 | Exceptional $57,384 |
| Immigrants | Hong Kong | 100.0 /100 | #8 | Exceptional $56,709 |
| Immigrants | Ireland | 100.0 /100 | #9 | Exceptional $56,584 |
| Okinawans | 100.0 /100 | #10 | Exceptional $55,817 |
| Eastern Europeans | 100.0 /100 | #11 | Exceptional $55,780 |
| Immigrants | Sweden | 100.0 /100 | #12 | Exceptional $55,582 |
| Immigrants | India | 100.0 /100 | #13 | Exceptional $55,268 |
| Immigrants | Belgium | 100.0 /100 | #14 | Exceptional $55,082 |
| Cypriots | 100.0 /100 | #15 | Exceptional $54,899 |
Demographics Similar to Immigrants from Kuwait by Per Capita Income
In terms of per capita income, the demographic groups most similar to Immigrants from Kuwait are Serbian ($46,551, a difference of 0.020%), Immigrants from Northern Africa ($46,531, a difference of 0.030%), British ($46,571, a difference of 0.060%), Ethiopian ($46,569, a difference of 0.060%), and Chilean ($46,459, a difference of 0.18%).
| Demographics | Rating | Rank | Per Capita Income |
| Immigrants | Uzbekistan | 97.5 /100 | #101 | Exceptional $46,929 |
| Immigrants | Western Asia | 97.4 /100 | #102 | Exceptional $46,876 |
| Syrians | 97.2 /100 | #103 | Exceptional $46,837 |
| Brazilians | 96.8 /100 | #104 | Exceptional $46,700 |
| British | 96.3 /100 | #105 | Exceptional $46,571 |
| Ethiopians | 96.3 /100 | #106 | Exceptional $46,569 |
| Serbians | 96.2 /100 | #107 | Exceptional $46,551 |
| Immigrants | Kuwait | 96.2 /100 | #108 | Exceptional $46,543 |
| Immigrants | Northern Africa | 96.2 /100 | #109 | Exceptional $46,531 |
| Chileans | 95.9 /100 | #110 | Exceptional $46,459 |
| Taiwanese | 95.8 /100 | #111 | Exceptional $46,455 |
| Immigrants | Morocco | 95.7 /100 | #112 | Exceptional $46,430 |
| Immigrants | Albania | 95.5 /100 | #113 | Exceptional $46,387 |
| Afghans | 94.9 /100 | #114 | Exceptional $46,268 |
| Immigrants | Chile | 94.6 /100 | #115 | Exceptional $46,213 |