Immigrants from Malaysia vs Immigrants from Kuwait Associate's Degree
COMPARE
Immigrants from Malaysia
Immigrants from Kuwait
Associate's Degree
Associate's Degree Comparison
Immigrants from Malaysia
Immigrants from Kuwait
52.5%
ASSOCIATE'S DEGREE
99.9/ 100
METRIC RATING
42nd/ 347
METRIC RANK
52.4%
ASSOCIATE'S DEGREE
99.9/ 100
METRIC RATING
47th/ 347
METRIC RANK
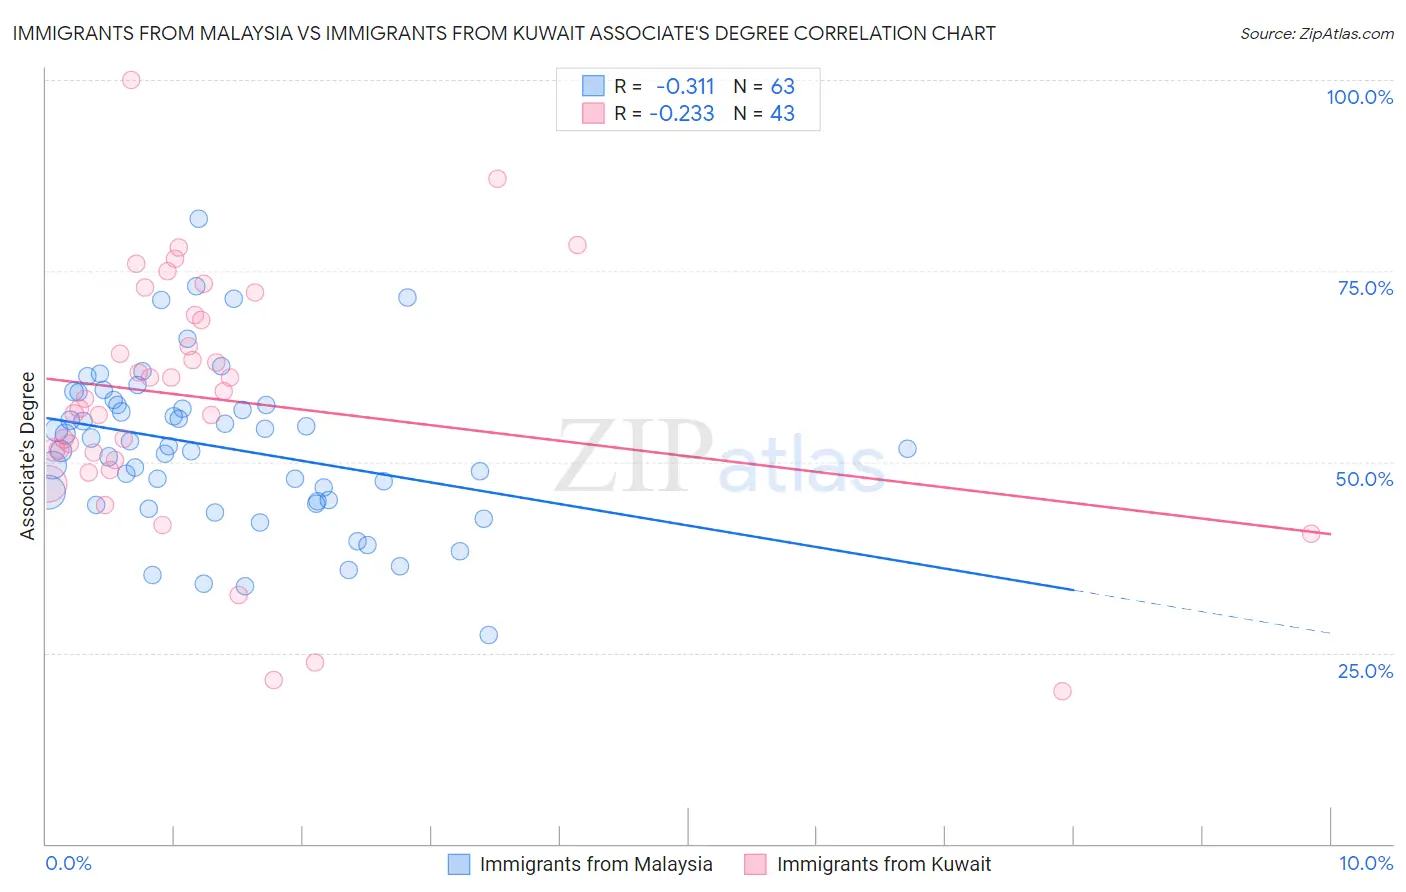
Immigrants from Malaysia vs Immigrants from Kuwait Associate's Degree Correlation Chart
The statistical analysis conducted on geographies consisting of 197,964,670 people shows a mild negative correlation between the proportion of Immigrants from Malaysia and percentage of population with at least associate's degree education in the United States with a correlation coefficient (R) of -0.311 and weighted average of 52.5%. Similarly, the statistical analysis conducted on geographies consisting of 136,917,085 people shows a weak negative correlation between the proportion of Immigrants from Kuwait and percentage of population with at least associate's degree education in the United States with a correlation coefficient (R) of -0.233 and weighted average of 52.4%, a difference of 0.32%.
Associate's Degree Correlation Summary
| Measurement | Immigrants from Malaysia | Immigrants from Kuwait |
| Minimum | 27.3% | 19.9% |
| Maximum | 81.8% | 100.0% |
| Range | 54.5% | 80.1% |
| Mean | 52.0% | 58.2% |
| Median | 52.0% | 58.2% |
| Interquartile 25% (IQ1) | 44.8% | 50.2% |
| Interquartile 75% (IQ3) | 57.5% | 69.3% |
| Interquartile Range (IQR) | 12.6% | 19.1% |
| Standard Deviation (Sample) | 10.5% | 16.5% |
| Standard Deviation (Population) | 10.4% | 16.3% |
Demographics Similar to Immigrants from Malaysia and Immigrants from Kuwait by Associate's Degree
In terms of associate's degree, the demographic groups most similar to Immigrants from Malaysia are Immigrants from South Africa (52.5%, a difference of 0.010%), Immigrants from Saudi Arabia (52.6%, a difference of 0.030%), Estonian (52.5%, a difference of 0.10%), Immigrants from Lithuania (52.4%, a difference of 0.17%), and Immigrants from Bulgaria (52.4%, a difference of 0.31%). Similarly, the demographic groups most similar to Immigrants from Kuwait are Immigrants from Bulgaria (52.4%, a difference of 0.010%), Immigrants from Lithuania (52.4%, a difference of 0.14%), Estonian (52.5%, a difference of 0.22%), Immigrants from Norway (52.2%, a difference of 0.26%), and Immigrants from South Africa (52.5%, a difference of 0.31%).
| Demographics | Rating | Rank | Associate's Degree |
| Bulgarians | 100.0 /100 | #34 | Exceptional 53.3% |
| Russians | 100.0 /100 | #35 | Exceptional 53.2% |
| Immigrants | Russia | 100.0 /100 | #36 | Exceptional 53.1% |
| Immigrants | Denmark | 100.0 /100 | #37 | Exceptional 53.1% |
| Mongolians | 100.0 /100 | #38 | Exceptional 53.0% |
| Immigrants | Belarus | 99.9 /100 | #39 | Exceptional 52.8% |
| Immigrants | Latvia | 99.9 /100 | #40 | Exceptional 52.8% |
| Immigrants | Saudi Arabia | 99.9 /100 | #41 | Exceptional 52.6% |
| Immigrants | Malaysia | 99.9 /100 | #42 | Exceptional 52.5% |
| Immigrants | South Africa | 99.9 /100 | #43 | Exceptional 52.5% |
| Estonians | 99.9 /100 | #44 | Exceptional 52.5% |
| Immigrants | Lithuania | 99.9 /100 | #45 | Exceptional 52.4% |
| Immigrants | Bulgaria | 99.9 /100 | #46 | Exceptional 52.4% |
| Immigrants | Kuwait | 99.9 /100 | #47 | Exceptional 52.4% |
| Immigrants | Norway | 99.9 /100 | #48 | Exceptional 52.2% |
| Immigrants | Austria | 99.9 /100 | #49 | Exceptional 52.1% |
| Asians | 99.9 /100 | #50 | Exceptional 52.1% |
| Immigrants | Greece | 99.9 /100 | #51 | Exceptional 52.1% |
| Bolivians | 99.8 /100 | #52 | Exceptional 52.0% |
| Immigrants | Asia | 99.8 /100 | #53 | Exceptional 52.0% |
| Immigrants | Spain | 99.8 /100 | #54 | Exceptional 51.9% |