Immigrants from Europe vs Immigrants from Germany 7th Grade
COMPARE
Immigrants from Europe
Immigrants from Germany
7th Grade
7th Grade Comparison
Immigrants from Europe
Immigrants from Germany
96.5%
7TH GRADE
94.8/ 100
METRIC RATING
122nd/ 347
METRIC RANK
96.7%
7TH GRADE
98.7/ 100
METRIC RATING
97th/ 347
METRIC RANK
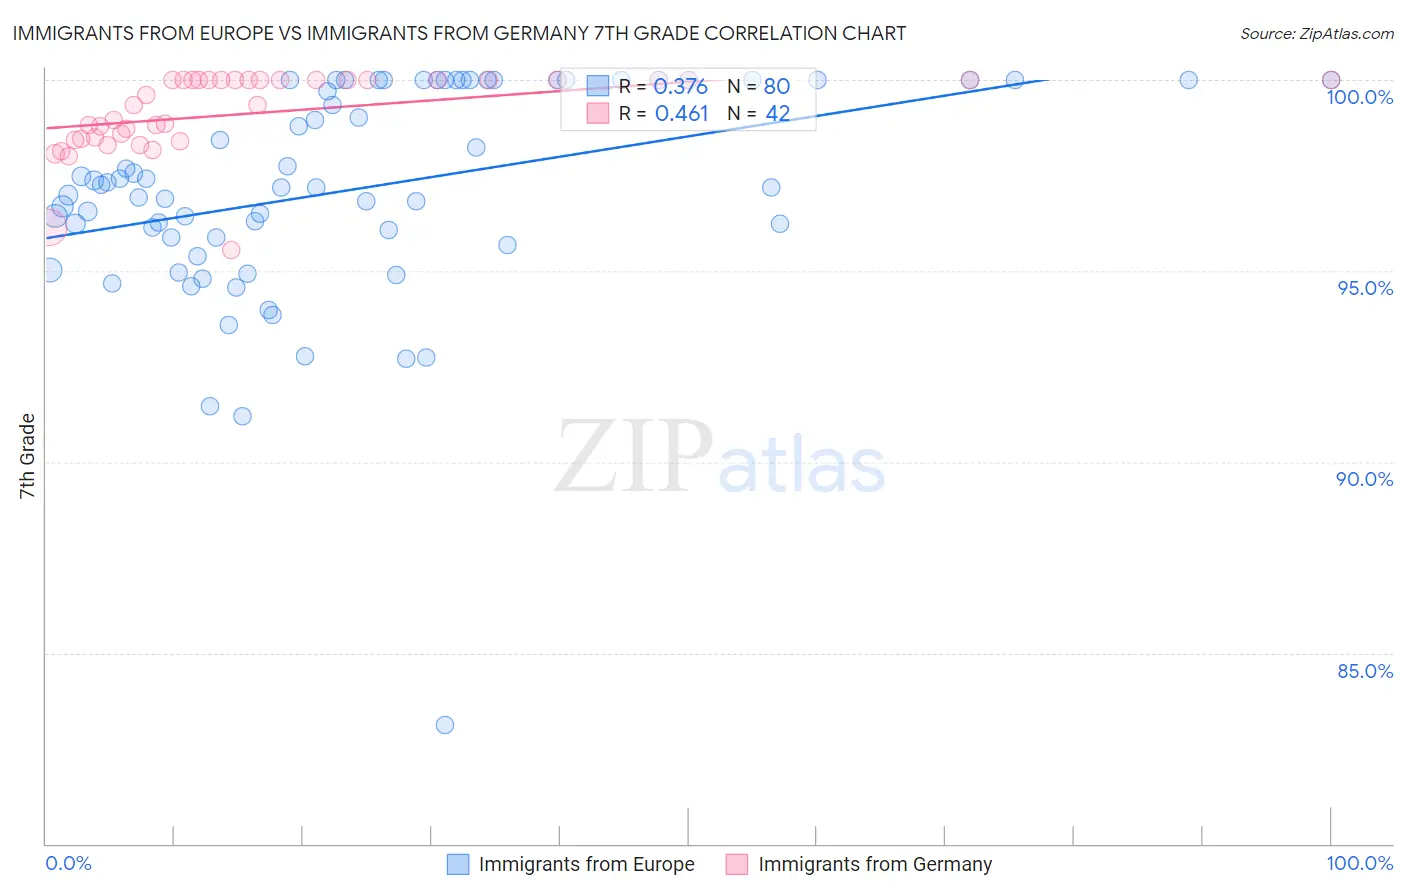
Immigrants from Europe vs Immigrants from Germany 7th Grade Correlation Chart
The statistical analysis conducted on geographies consisting of 547,425,973 people shows a mild positive correlation between the proportion of Immigrants from Europe and percentage of population with at least 7th grade education in the United States with a correlation coefficient (R) of 0.376 and weighted average of 96.5%. Similarly, the statistical analysis conducted on geographies consisting of 463,886,845 people shows a moderate positive correlation between the proportion of Immigrants from Germany and percentage of population with at least 7th grade education in the United States with a correlation coefficient (R) of 0.461 and weighted average of 96.7%, a difference of 0.21%.
7th Grade Correlation Summary
| Measurement | Immigrants from Europe | Immigrants from Germany |
| Minimum | 83.1% | 95.6% |
| Maximum | 100.0% | 100.0% |
| Range | 16.9% | 4.4% |
| Mean | 97.2% | 99.1% |
| Median | 97.2% | 99.5% |
| Interquartile 25% (IQ1) | 95.9% | 98.5% |
| Interquartile 75% (IQ3) | 100.0% | 100.0% |
| Interquartile Range (IQR) | 4.1% | 1.5% |
| Standard Deviation (Sample) | 2.8% | 1.1% |
| Standard Deviation (Population) | 2.8% | 1.0% |
Similar Demographics by 7th Grade
Demographics Similar to Immigrants from Europe by 7th Grade
In terms of 7th grade, the demographic groups most similar to Immigrants from Europe are Cheyenne (96.5%, a difference of 0.0%), Immigrants from France (96.5%, a difference of 0.0%), Immigrants from Norway (96.5%, a difference of 0.010%), Immigrants from Croatia (96.5%, a difference of 0.010%), and Immigrants from Switzerland (96.5%, a difference of 0.010%).
| Demographics | Rating | Rank | 7th Grade |
| Choctaw | 96.6 /100 | #115 | Exceptional 96.5% |
| Syrians | 96.6 /100 | #116 | Exceptional 96.5% |
| Immigrants | Moldova | 95.7 /100 | #117 | Exceptional 96.5% |
| Immigrants | Japan | 95.5 /100 | #118 | Exceptional 96.5% |
| Immigrants | Norway | 95.2 /100 | #119 | Exceptional 96.5% |
| Immigrants | Croatia | 95.0 /100 | #120 | Exceptional 96.5% |
| Cheyenne | 94.9 /100 | #121 | Exceptional 96.5% |
| Immigrants | Europe | 94.8 /100 | #122 | Exceptional 96.5% |
| Immigrants | France | 94.7 /100 | #123 | Exceptional 96.5% |
| Immigrants | Switzerland | 94.5 /100 | #124 | Exceptional 96.5% |
| Immigrants | Bulgaria | 94.0 /100 | #125 | Exceptional 96.4% |
| Palestinians | 93.5 /100 | #126 | Exceptional 96.4% |
| Immigrants | Bosnia and Herzegovina | 93.3 /100 | #127 | Exceptional 96.4% |
| Immigrants | Romania | 93.2 /100 | #128 | Exceptional 96.4% |
| Immigrants | North Macedonia | 93.1 /100 | #129 | Exceptional 96.4% |
Demographics Similar to Immigrants from Germany by 7th Grade
In terms of 7th grade, the demographic groups most similar to Immigrants from Germany are Immigrants from Denmark (96.7%, a difference of 0.0%), Immigrants from Sweden (96.7%, a difference of 0.0%), Menominee (96.7%, a difference of 0.0%), Immigrants from Australia (96.7%, a difference of 0.010%), and German Russian (96.7%, a difference of 0.010%).
| Demographics | Rating | Rank | 7th Grade |
| Immigrants | South Africa | 98.9 /100 | #90 | Exceptional 96.7% |
| Osage | 98.9 /100 | #91 | Exceptional 96.7% |
| Immigrants | Western Europe | 98.9 /100 | #92 | Exceptional 96.7% |
| Potawatomi | 98.9 /100 | #93 | Exceptional 96.7% |
| Lebanese | 98.8 /100 | #94 | Exceptional 96.7% |
| Immigrants | Australia | 98.8 /100 | #95 | Exceptional 96.7% |
| Immigrants | Denmark | 98.7 /100 | #96 | Exceptional 96.7% |
| Immigrants | Germany | 98.7 /100 | #97 | Exceptional 96.7% |
| Immigrants | Sweden | 98.7 /100 | #98 | Exceptional 96.7% |
| Menominee | 98.7 /100 | #99 | Exceptional 96.7% |
| German Russians | 98.6 /100 | #100 | Exceptional 96.7% |
| Thais | 98.6 /100 | #101 | Exceptional 96.7% |
| Immigrants | Czechoslovakia | 98.3 /100 | #102 | Exceptional 96.6% |
| Immigrants | Singapore | 98.3 /100 | #103 | Exceptional 96.6% |
| Shoshone | 98.1 /100 | #104 | Exceptional 96.6% |