Immigrants from Indonesia vs Immigrants from Germany 7th Grade
COMPARE
Immigrants from Indonesia
Immigrants from Germany
7th Grade
7th Grade Comparison
Immigrants from Indonesia
Immigrants from Germany
95.5%
7TH GRADE
3.3/ 100
METRIC RATING
233rd/ 347
METRIC RANK
96.7%
7TH GRADE
98.7/ 100
METRIC RATING
97th/ 347
METRIC RANK
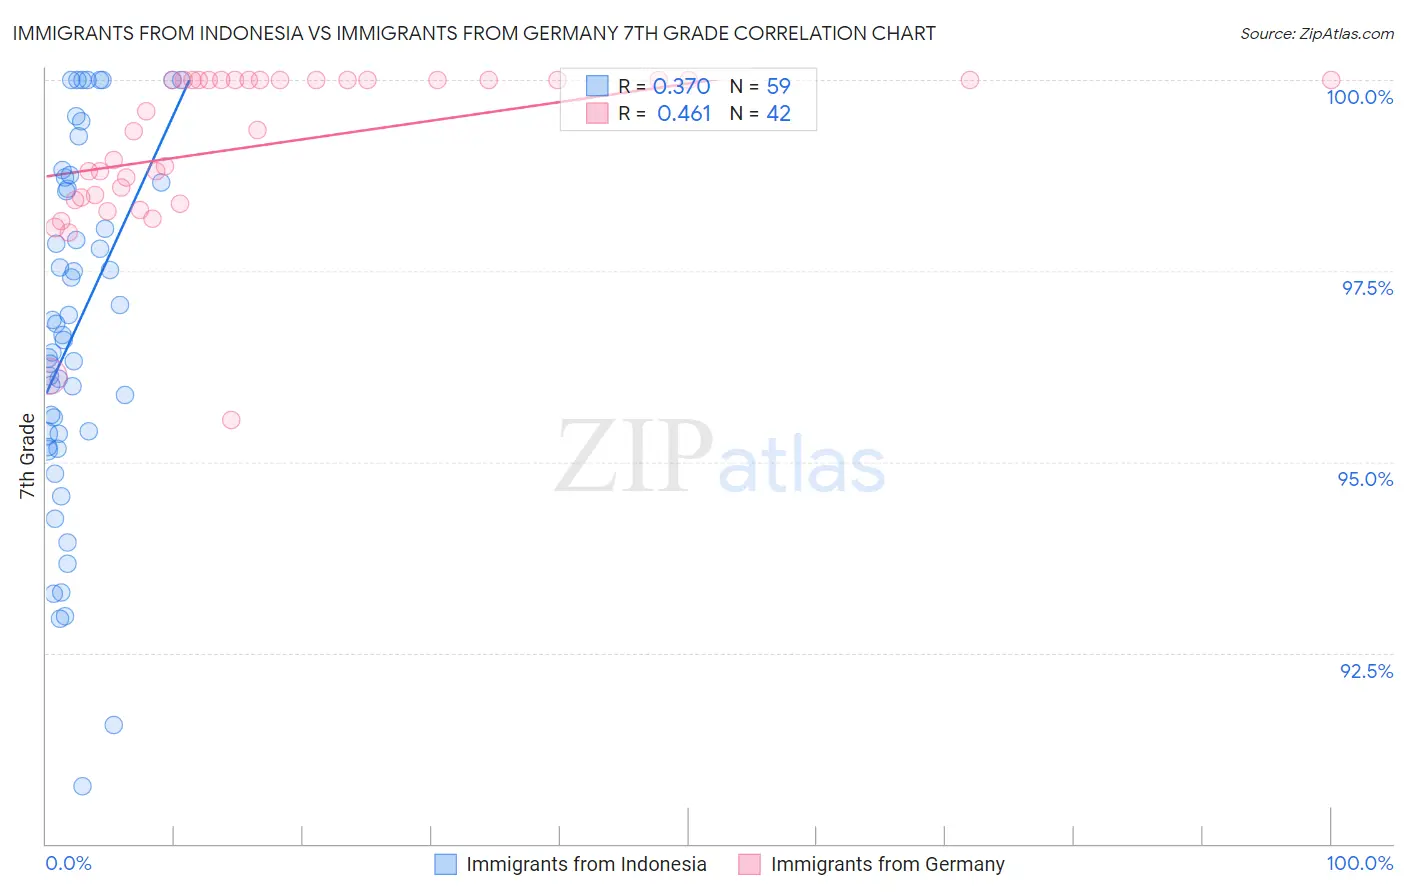
Immigrants from Indonesia vs Immigrants from Germany 7th Grade Correlation Chart
The statistical analysis conducted on geographies consisting of 215,671,959 people shows a mild positive correlation between the proportion of Immigrants from Indonesia and percentage of population with at least 7th grade education in the United States with a correlation coefficient (R) of 0.370 and weighted average of 95.5%. Similarly, the statistical analysis conducted on geographies consisting of 463,886,845 people shows a moderate positive correlation between the proportion of Immigrants from Germany and percentage of population with at least 7th grade education in the United States with a correlation coefficient (R) of 0.461 and weighted average of 96.7%, a difference of 1.2%.
7th Grade Correlation Summary
| Measurement | Immigrants from Indonesia | Immigrants from Germany |
| Minimum | 90.7% | 95.6% |
| Maximum | 100.0% | 100.0% |
| Range | 9.3% | 4.4% |
| Mean | 96.7% | 99.1% |
| Median | 96.7% | 99.5% |
| Interquartile 25% (IQ1) | 95.4% | 98.5% |
| Interquartile 75% (IQ3) | 98.7% | 100.0% |
| Interquartile Range (IQR) | 3.3% | 1.5% |
| Standard Deviation (Sample) | 2.3% | 1.1% |
| Standard Deviation (Population) | 2.3% | 1.0% |
Similar Demographics by 7th Grade
Demographics Similar to Immigrants from Indonesia by 7th Grade
In terms of 7th grade, the demographic groups most similar to Immigrants from Indonesia are Costa Rican (95.5%, a difference of 0.0%), Nigerian (95.5%, a difference of 0.020%), Senegalese (95.6%, a difference of 0.030%), Immigrants from Africa (95.5%, a difference of 0.030%), and Native/Alaskan (95.6%, a difference of 0.040%).
| Demographics | Rating | Rank | 7th Grade |
| Immigrants | Eastern Asia | 5.8 /100 | #226 | Tragic 95.6% |
| Immigrants | Western Asia | 5.4 /100 | #227 | Tragic 95.6% |
| Immigrants | Eastern Africa | 5.1 /100 | #228 | Tragic 95.6% |
| Immigrants | Panama | 4.9 /100 | #229 | Tragic 95.6% |
| Natives/Alaskans | 4.2 /100 | #230 | Tragic 95.6% |
| Senegalese | 4.0 /100 | #231 | Tragic 95.6% |
| Costa Ricans | 3.3 /100 | #232 | Tragic 95.5% |
| Immigrants | Indonesia | 3.3 /100 | #233 | Tragic 95.5% |
| Nigerians | 3.0 /100 | #234 | Tragic 95.5% |
| Immigrants | Africa | 2.7 /100 | #235 | Tragic 95.5% |
| Asians | 2.6 /100 | #236 | Tragic 95.5% |
| Immigrants | Asia | 2.3 /100 | #237 | Tragic 95.5% |
| Indians (Asian) | 2.3 /100 | #238 | Tragic 95.5% |
| Jamaicans | 2.2 /100 | #239 | Tragic 95.5% |
| Immigrants | Sierra Leone | 2.0 /100 | #240 | Tragic 95.5% |
Demographics Similar to Immigrants from Germany by 7th Grade
In terms of 7th grade, the demographic groups most similar to Immigrants from Germany are Immigrants from Denmark (96.7%, a difference of 0.0%), Immigrants from Sweden (96.7%, a difference of 0.0%), Menominee (96.7%, a difference of 0.0%), Immigrants from Australia (96.7%, a difference of 0.010%), and German Russian (96.7%, a difference of 0.010%).
| Demographics | Rating | Rank | 7th Grade |
| Immigrants | South Africa | 98.9 /100 | #90 | Exceptional 96.7% |
| Osage | 98.9 /100 | #91 | Exceptional 96.7% |
| Immigrants | Western Europe | 98.9 /100 | #92 | Exceptional 96.7% |
| Potawatomi | 98.9 /100 | #93 | Exceptional 96.7% |
| Lebanese | 98.8 /100 | #94 | Exceptional 96.7% |
| Immigrants | Australia | 98.8 /100 | #95 | Exceptional 96.7% |
| Immigrants | Denmark | 98.7 /100 | #96 | Exceptional 96.7% |
| Immigrants | Germany | 98.7 /100 | #97 | Exceptional 96.7% |
| Immigrants | Sweden | 98.7 /100 | #98 | Exceptional 96.7% |
| Menominee | 98.7 /100 | #99 | Exceptional 96.7% |
| German Russians | 98.6 /100 | #100 | Exceptional 96.7% |
| Thais | 98.6 /100 | #101 | Exceptional 96.7% |
| Immigrants | Czechoslovakia | 98.3 /100 | #102 | Exceptional 96.6% |
| Immigrants | Singapore | 98.3 /100 | #103 | Exceptional 96.6% |
| Shoshone | 98.1 /100 | #104 | Exceptional 96.6% |