Moroccan vs Immigrants from Germany 7th Grade
COMPARE
Moroccan
Immigrants from Germany
7th Grade
7th Grade Comparison
Moroccans
Immigrants from Germany
95.8%
7TH GRADE
18.9/ 100
METRIC RATING
205th/ 347
METRIC RANK
96.7%
7TH GRADE
98.7/ 100
METRIC RATING
97th/ 347
METRIC RANK
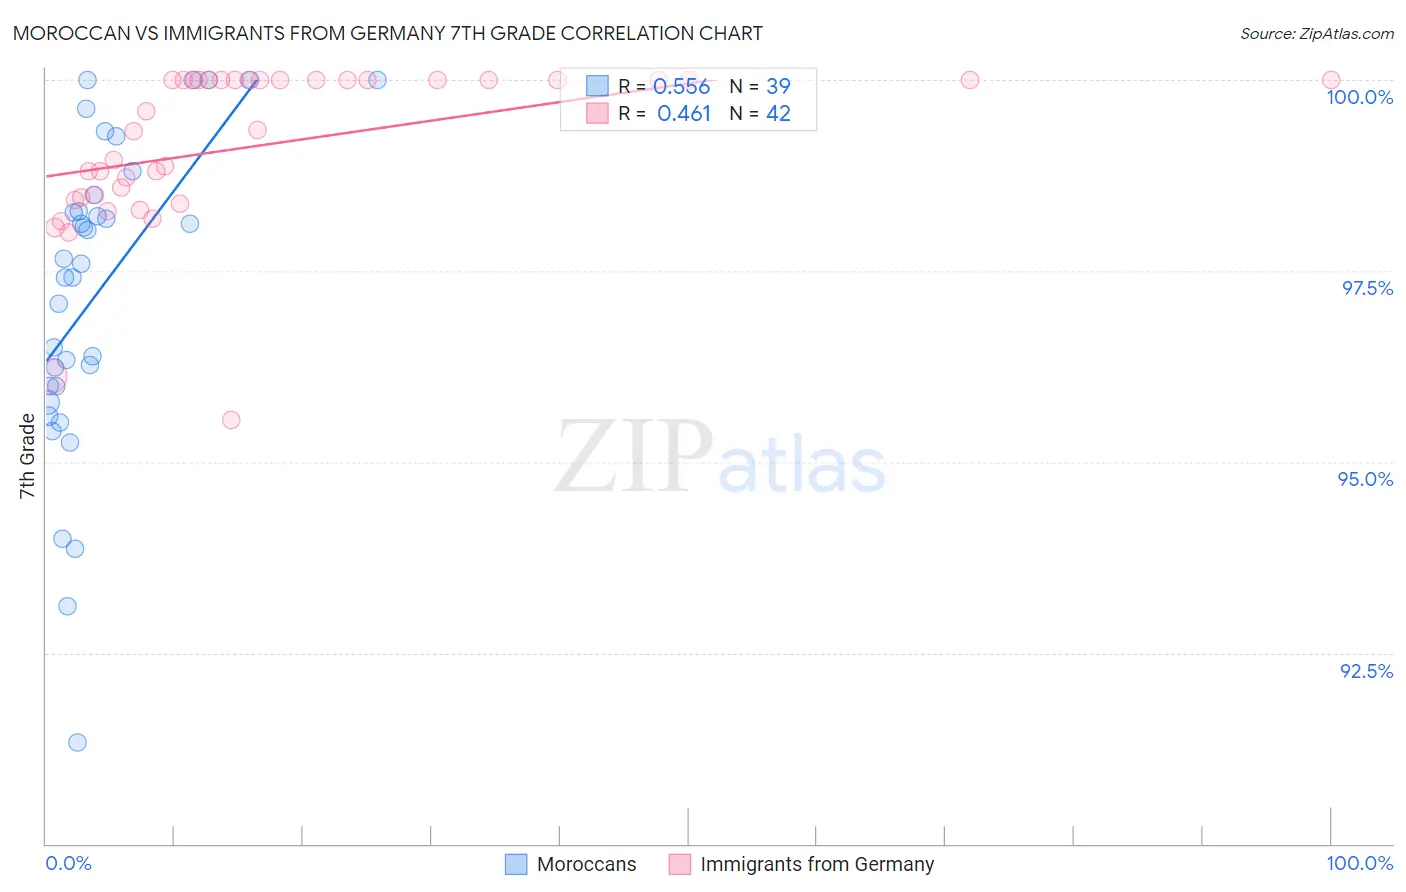
Moroccan vs Immigrants from Germany 7th Grade Correlation Chart
The statistical analysis conducted on geographies consisting of 201,817,667 people shows a substantial positive correlation between the proportion of Moroccans and percentage of population with at least 7th grade education in the United States with a correlation coefficient (R) of 0.556 and weighted average of 95.8%. Similarly, the statistical analysis conducted on geographies consisting of 463,886,845 people shows a moderate positive correlation between the proportion of Immigrants from Germany and percentage of population with at least 7th grade education in the United States with a correlation coefficient (R) of 0.461 and weighted average of 96.7%, a difference of 0.89%.
7th Grade Correlation Summary
| Measurement | Moroccan | Immigrants from Germany |
| Minimum | 91.3% | 95.6% |
| Maximum | 100.0% | 100.0% |
| Range | 8.7% | 4.4% |
| Mean | 97.2% | 99.1% |
| Median | 97.6% | 99.5% |
| Interquartile 25% (IQ1) | 96.0% | 98.5% |
| Interquartile 75% (IQ3) | 98.5% | 100.0% |
| Interquartile Range (IQR) | 2.5% | 1.5% |
| Standard Deviation (Sample) | 2.0% | 1.1% |
| Standard Deviation (Population) | 2.0% | 1.0% |
Similar Demographics by 7th Grade
Demographics Similar to Moroccans by 7th Grade
In terms of 7th grade, the demographic groups most similar to Moroccans are African (95.8%, a difference of 0.010%), Immigrants from Northern Africa (95.8%, a difference of 0.020%), Comanche (95.8%, a difference of 0.020%), Assyrian/Chaldean/Syriac (95.8%, a difference of 0.020%), and Navajo (95.8%, a difference of 0.020%).
| Demographics | Rating | Rank | 7th Grade |
| Paraguayans | 24.8 /100 | #198 | Fair 95.9% |
| Guamanians/Chamorros | 23.5 /100 | #199 | Fair 95.9% |
| Argentineans | 23.2 /100 | #200 | Fair 95.9% |
| Immigrants | Argentina | 21.9 /100 | #201 | Fair 95.9% |
| Immigrants | Northern Africa | 21.4 /100 | #202 | Fair 95.8% |
| Comanche | 21.1 /100 | #203 | Fair 95.8% |
| Assyrians/Chaldeans/Syriacs | 20.5 /100 | #204 | Fair 95.8% |
| Moroccans | 18.9 /100 | #205 | Poor 95.8% |
| Africans | 17.6 /100 | #206 | Poor 95.8% |
| Navajo | 17.0 /100 | #207 | Poor 95.8% |
| Immigrants | Sudan | 17.0 /100 | #208 | Poor 95.8% |
| Dutch West Indians | 16.1 /100 | #209 | Poor 95.8% |
| Hawaiians | 16.0 /100 | #210 | Poor 95.8% |
| Portuguese | 13.6 /100 | #211 | Poor 95.8% |
| Immigrants | Lebanon | 13.0 /100 | #212 | Poor 95.8% |
Demographics Similar to Immigrants from Germany by 7th Grade
In terms of 7th grade, the demographic groups most similar to Immigrants from Germany are Immigrants from Denmark (96.7%, a difference of 0.0%), Immigrants from Sweden (96.7%, a difference of 0.0%), Menominee (96.7%, a difference of 0.0%), Immigrants from Australia (96.7%, a difference of 0.010%), and German Russian (96.7%, a difference of 0.010%).
| Demographics | Rating | Rank | 7th Grade |
| Immigrants | South Africa | 98.9 /100 | #90 | Exceptional 96.7% |
| Osage | 98.9 /100 | #91 | Exceptional 96.7% |
| Immigrants | Western Europe | 98.9 /100 | #92 | Exceptional 96.7% |
| Potawatomi | 98.9 /100 | #93 | Exceptional 96.7% |
| Lebanese | 98.8 /100 | #94 | Exceptional 96.7% |
| Immigrants | Australia | 98.8 /100 | #95 | Exceptional 96.7% |
| Immigrants | Denmark | 98.7 /100 | #96 | Exceptional 96.7% |
| Immigrants | Germany | 98.7 /100 | #97 | Exceptional 96.7% |
| Immigrants | Sweden | 98.7 /100 | #98 | Exceptional 96.7% |
| Menominee | 98.7 /100 | #99 | Exceptional 96.7% |
| German Russians | 98.6 /100 | #100 | Exceptional 96.7% |
| Thais | 98.6 /100 | #101 | Exceptional 96.7% |
| Immigrants | Czechoslovakia | 98.3 /100 | #102 | Exceptional 96.6% |
| Immigrants | Singapore | 98.3 /100 | #103 | Exceptional 96.6% |
| Shoshone | 98.1 /100 | #104 | Exceptional 96.6% |