Iranian vs Afghan Unemployment Among Ages 20 to 24 years
COMPARE
Iranian
Afghan
Unemployment Among Ages 20 to 24 years
Unemployment Among Ages 20 to 24 years Comparison
Iranians
Afghans
10.2%
UNEMPLOYMENT AMONG AGES 20 TO 24 YEARS
72.4/ 100
METRIC RATING
152nd/ 347
METRIC RANK
9.6%
UNEMPLOYMENT AMONG AGES 20 TO 24 YEARS
99.9/ 100
METRIC RATING
38th/ 347
METRIC RANK
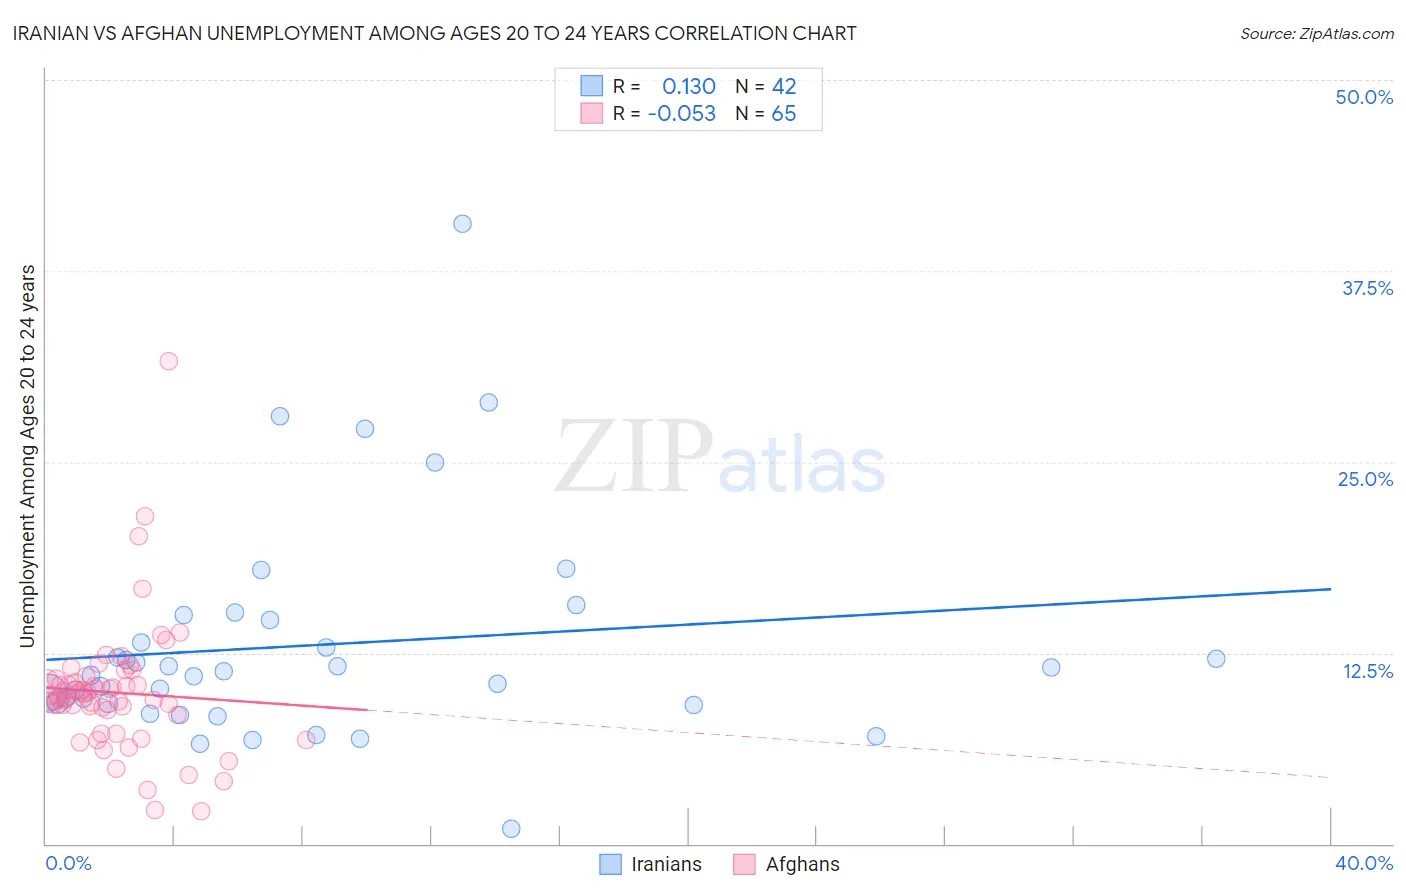
Iranian vs Afghan Unemployment Among Ages 20 to 24 years Correlation Chart
The statistical analysis conducted on geographies consisting of 310,673,283 people shows a poor positive correlation between the proportion of Iranians and unemployment rate among population between the ages 20 and 24 in the United States with a correlation coefficient (R) of 0.130 and weighted average of 10.2%. Similarly, the statistical analysis conducted on geographies consisting of 147,858,089 people shows a slight negative correlation between the proportion of Afghans and unemployment rate among population between the ages 20 and 24 in the United States with a correlation coefficient (R) of -0.053 and weighted average of 9.6%, a difference of 6.5%.
Unemployment Among Ages 20 to 24 years Correlation Summary
| Measurement | Iranian | Afghan |
| Minimum | 1.0% | 2.1% |
| Maximum | 40.6% | 31.6% |
| Range | 39.6% | 29.5% |
| Mean | 13.0% | 9.9% |
| Median | 11.2% | 9.7% |
| Interquartile 25% (IQ1) | 9.2% | 8.6% |
| Interquartile 75% (IQ3) | 14.6% | 10.7% |
| Interquartile Range (IQR) | 5.4% | 2.1% |
| Standard Deviation (Sample) | 7.3% | 4.3% |
| Standard Deviation (Population) | 7.2% | 4.3% |
Similar Demographics by Unemployment Among Ages 20 to 24 years
Demographics Similar to Iranians by Unemployment Among Ages 20 to 24 years
In terms of unemployment among ages 20 to 24 years, the demographic groups most similar to Iranians are Immigrants from Taiwan (10.2%, a difference of 0.040%), Immigrants from Switzerland (10.2%, a difference of 0.050%), Immigrants from South Africa (10.2%, a difference of 0.060%), Immigrants from Scotland (10.2%, a difference of 0.10%), and Hungarian (10.2%, a difference of 0.10%).
| Demographics | Rating | Rank | Unemployment Among Ages 20 to 24 years |
| Argentineans | 78.0 /100 | #145 | Good 10.2% |
| Asians | 77.7 /100 | #146 | Good 10.2% |
| French Canadians | 77.5 /100 | #147 | Good 10.2% |
| Immigrants | Romania | 75.7 /100 | #148 | Good 10.2% |
| Immigrants | Scotland | 74.6 /100 | #149 | Good 10.2% |
| Hungarians | 74.4 /100 | #150 | Good 10.2% |
| Immigrants | South Africa | 73.6 /100 | #151 | Good 10.2% |
| Iranians | 72.4 /100 | #152 | Good 10.2% |
| Immigrants | Taiwan | 71.4 /100 | #153 | Good 10.2% |
| Immigrants | Switzerland | 71.3 /100 | #154 | Good 10.2% |
| Lithuanians | 70.0 /100 | #155 | Good 10.2% |
| Canadians | 66.7 /100 | #156 | Good 10.2% |
| Immigrants | Uganda | 65.6 /100 | #157 | Good 10.2% |
| Immigrants | Kazakhstan | 65.5 /100 | #158 | Good 10.2% |
| Immigrants | England | 63.7 /100 | #159 | Good 10.3% |
Demographics Similar to Afghans by Unemployment Among Ages 20 to 24 years
In terms of unemployment among ages 20 to 24 years, the demographic groups most similar to Afghans are Immigrants from Zaire (9.6%, a difference of 0.070%), Belgian (9.6%, a difference of 0.15%), German (9.6%, a difference of 0.18%), Dutch (9.6%, a difference of 0.22%), and Yugoslavian (9.6%, a difference of 0.25%).
| Demographics | Rating | Rank | Unemployment Among Ages 20 to 24 years |
| Immigrants | Eastern Africa | 100.0 /100 | #31 | Exceptional 9.5% |
| Cambodians | 100.0 /100 | #32 | Exceptional 9.5% |
| Australians | 100.0 /100 | #33 | Exceptional 9.6% |
| Yugoslavians | 100.0 /100 | #34 | Exceptional 9.6% |
| Germans | 100.0 /100 | #35 | Exceptional 9.6% |
| Belgians | 100.0 /100 | #36 | Exceptional 9.6% |
| Immigrants | Zaire | 100.0 /100 | #37 | Exceptional 9.6% |
| Afghans | 99.9 /100 | #38 | Exceptional 9.6% |
| Dutch | 99.9 /100 | #39 | Exceptional 9.6% |
| Immigrants | Ethiopia | 99.9 /100 | #40 | Exceptional 9.6% |
| Swiss | 99.9 /100 | #41 | Exceptional 9.7% |
| Immigrants | Saudi Arabia | 99.9 /100 | #42 | Exceptional 9.7% |
| Menominee | 99.8 /100 | #43 | Exceptional 9.7% |
| Europeans | 99.8 /100 | #44 | Exceptional 9.7% |
| Croatians | 99.8 /100 | #45 | Exceptional 9.7% |