Inupiat vs Immigrants from France No Schooling Completed
COMPARE
Inupiat
Immigrants from France
No Schooling Completed
No Schooling Completed Comparison
Inupiat
Immigrants from France
1.5%
NO SCHOOLING COMPLETED
100.0/ 100
METRIC RATING
31st/ 347
METRIC RANK
1.8%
NO SCHOOLING COMPLETED
97.3/ 100
METRIC RATING
106th/ 347
METRIC RANK
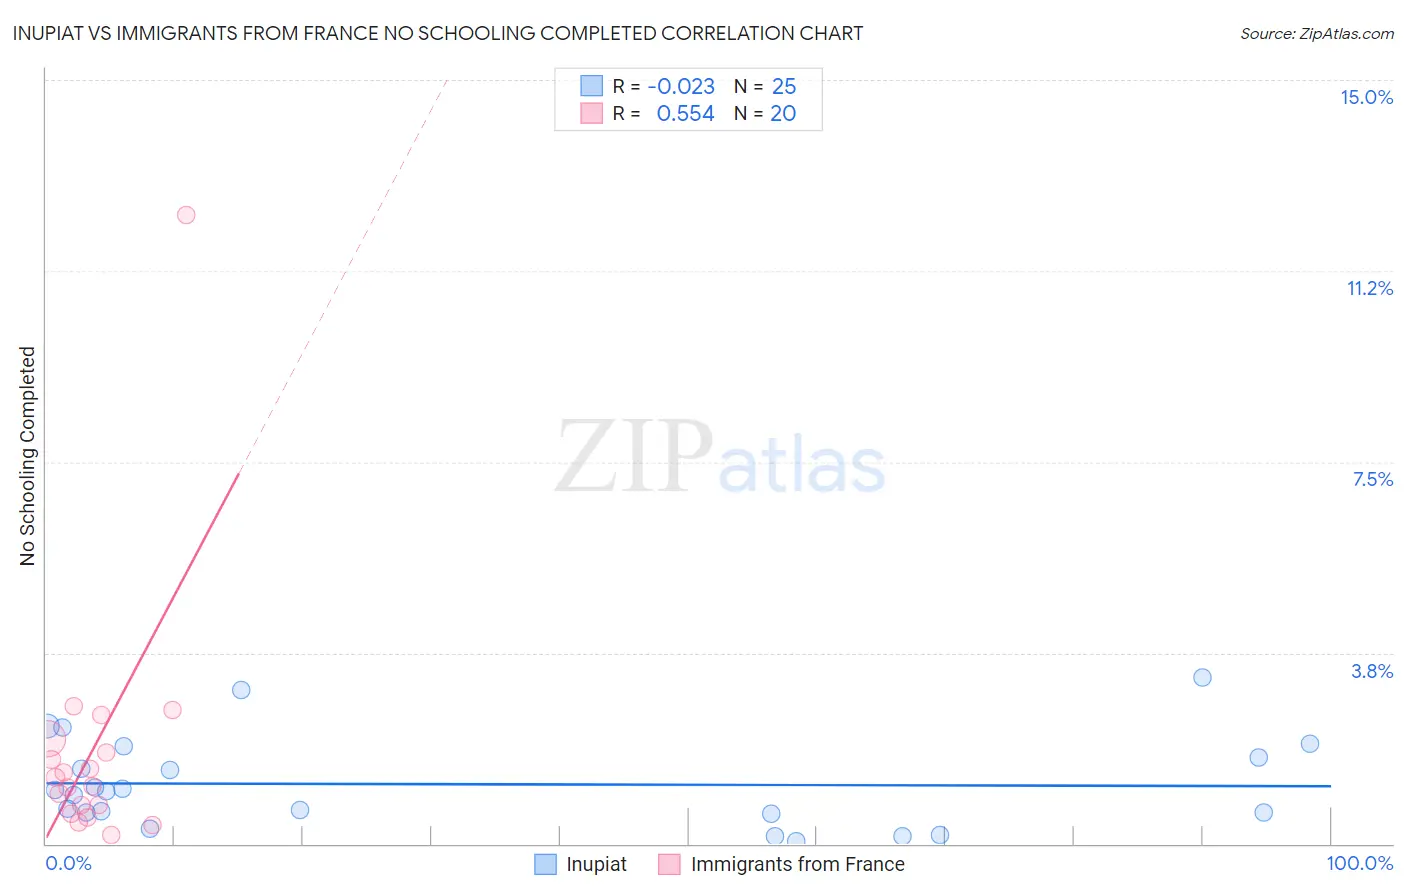
Inupiat vs Immigrants from France No Schooling Completed Correlation Chart
The statistical analysis conducted on geographies consisting of 95,835,764 people shows no correlation between the proportion of Inupiat and percentage of population with no schooling in the United States with a correlation coefficient (R) of -0.023 and weighted average of 1.5%. Similarly, the statistical analysis conducted on geographies consisting of 285,710,954 people shows a substantial positive correlation between the proportion of Immigrants from France and percentage of population with no schooling in the United States with a correlation coefficient (R) of 0.554 and weighted average of 1.8%, a difference of 21.0%.
No Schooling Completed Correlation Summary
| Measurement | Inupiat | Immigrants from France |
| Minimum | 0.041% | 0.17% |
| Maximum | 3.3% | 12.3% |
| Range | 3.2% | 12.2% |
| Mean | 1.2% | 1.8% |
| Median | 1.0% | 1.2% |
| Interquartile 25% (IQ1) | 0.60% | 0.68% |
| Interquartile 75% (IQ3) | 1.8% | 1.9% |
| Interquartile Range (IQR) | 1.2% | 1.2% |
| Standard Deviation (Sample) | 0.89% | 2.6% |
| Standard Deviation (Population) | 0.87% | 2.5% |
Similar Demographics by No Schooling Completed
Demographics Similar to Inupiat by No Schooling Completed
In terms of no schooling completed, the demographic groups most similar to Inupiat are British (1.5%, a difference of 0.030%), Swiss (1.5%, a difference of 0.39%), Lumbee (1.5%, a difference of 0.51%), Italian (1.5%, a difference of 1.1%), and Latvian (1.5%, a difference of 1.3%).
| Demographics | Rating | Rank | No Schooling Completed |
| Pennsylvania Germans | 100.0 /100 | #24 | Exceptional 1.5% |
| French | 100.0 /100 | #25 | Exceptional 1.5% |
| Czechs | 100.0 /100 | #26 | Exceptional 1.5% |
| Scandinavians | 100.0 /100 | #27 | Exceptional 1.5% |
| French Canadians | 100.0 /100 | #28 | Exceptional 1.5% |
| Lumbee | 100.0 /100 | #29 | Exceptional 1.5% |
| British | 100.0 /100 | #30 | Exceptional 1.5% |
| Inupiat | 100.0 /100 | #31 | Exceptional 1.5% |
| Swiss | 100.0 /100 | #32 | Exceptional 1.5% |
| Italians | 100.0 /100 | #33 | Exceptional 1.5% |
| Latvians | 100.0 /100 | #34 | Exceptional 1.5% |
| Eastern Europeans | 100.0 /100 | #35 | Exceptional 1.6% |
| Aleuts | 99.9 /100 | #36 | Exceptional 1.6% |
| Belgians | 99.9 /100 | #37 | Exceptional 1.6% |
| Northern Europeans | 99.9 /100 | #38 | Exceptional 1.6% |
Demographics Similar to Immigrants from France by No Schooling Completed
In terms of no schooling completed, the demographic groups most similar to Immigrants from France are Yugoslavian (1.8%, a difference of 0.040%), Okinawan (1.8%, a difference of 0.26%), German Russian (1.8%, a difference of 0.40%), Thai (1.8%, a difference of 0.42%), and Immigrants from Saudi Arabia (1.9%, a difference of 0.60%).
| Demographics | Rating | Rank | No Schooling Completed |
| Choctaw | 98.1 /100 | #99 | Exceptional 1.8% |
| Immigrants | Singapore | 98.0 /100 | #100 | Exceptional 1.8% |
| Immigrants | Czechoslovakia | 97.9 /100 | #101 | Exceptional 1.8% |
| Immigrants | Switzerland | 97.9 /100 | #102 | Exceptional 1.8% |
| Basques | 97.9 /100 | #103 | Exceptional 1.8% |
| Thais | 97.5 /100 | #104 | Exceptional 1.8% |
| German Russians | 97.5 /100 | #105 | Exceptional 1.8% |
| Immigrants | France | 97.3 /100 | #106 | Exceptional 1.8% |
| Yugoslavians | 97.2 /100 | #107 | Exceptional 1.8% |
| Okinawans | 97.1 /100 | #108 | Exceptional 1.8% |
| Immigrants | Saudi Arabia | 96.8 /100 | #109 | Exceptional 1.9% |
| Immigrants | Latvia | 96.7 /100 | #110 | Exceptional 1.9% |
| Immigrants | Japan | 96.6 /100 | #111 | Exceptional 1.9% |
| Pueblo | 96.4 /100 | #112 | Exceptional 1.9% |
| Immigrants | Zimbabwe | 96.2 /100 | #113 | Exceptional 1.9% |