Inupiat vs Immigrants from France Child Poverty Under the Age of 5
COMPARE
Inupiat
Immigrants from France
Child Poverty Under the Age of 5
Child Poverty Under the Age of 5 Comparison
Inupiat
Immigrants from France
22.0%
CHILD POVERTY UNDER THE AGE OF 5
0.0/ 100
METRIC RATING
303rd/ 347
METRIC RANK
15.6%
CHILD POVERTY UNDER THE AGE OF 5
97.3/ 100
METRIC RATING
90th/ 347
METRIC RANK
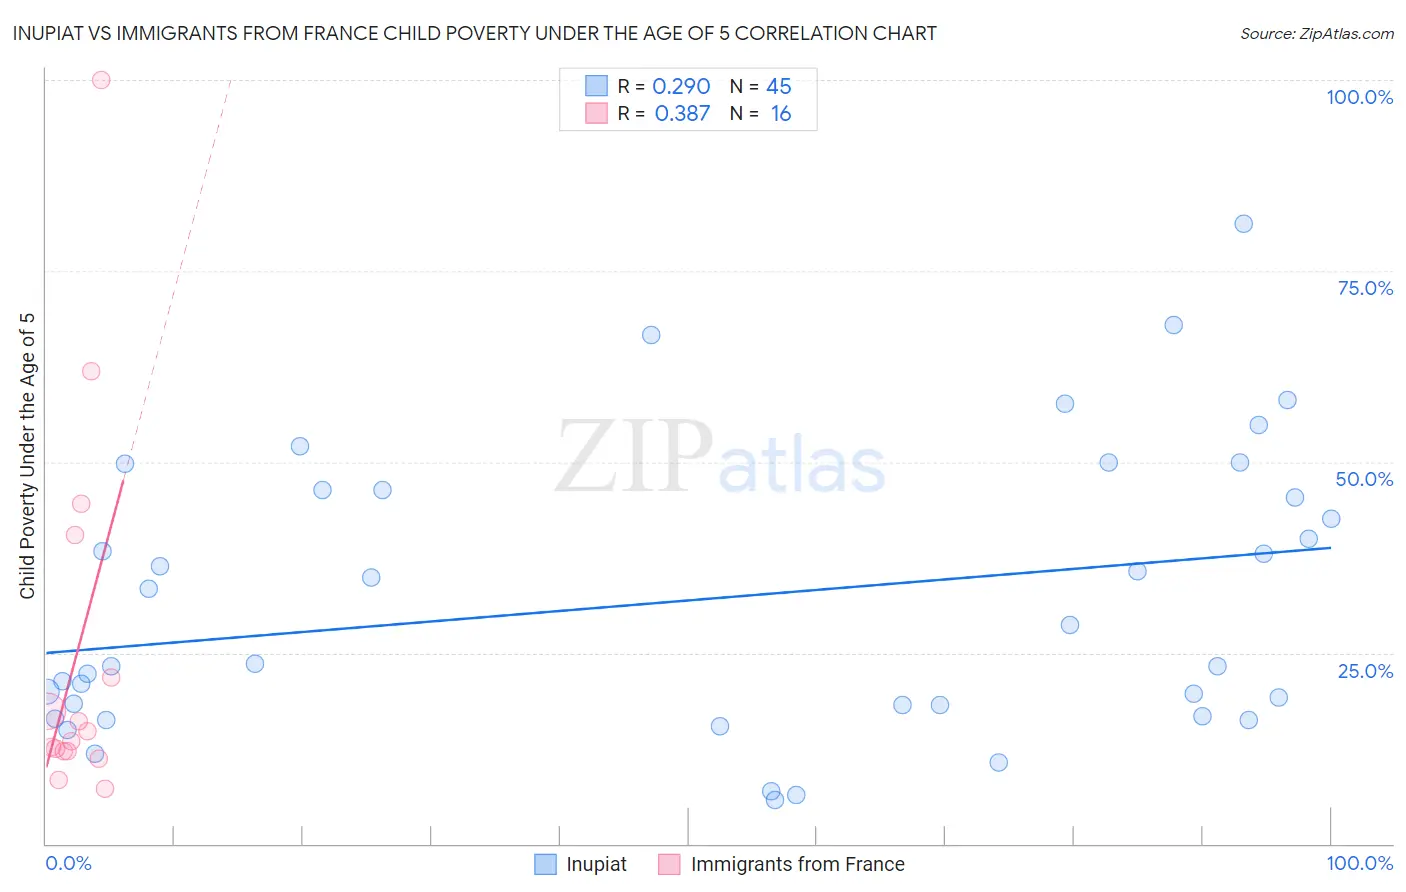
Inupiat vs Immigrants from France Child Poverty Under the Age of 5 Correlation Chart
The statistical analysis conducted on geographies consisting of 95,492,262 people shows a weak positive correlation between the proportion of Inupiat and poverty level among children under the age of 5 in the United States with a correlation coefficient (R) of 0.290 and weighted average of 22.0%. Similarly, the statistical analysis conducted on geographies consisting of 277,843,690 people shows a mild positive correlation between the proportion of Immigrants from France and poverty level among children under the age of 5 in the United States with a correlation coefficient (R) of 0.387 and weighted average of 15.6%, a difference of 40.8%.
Child Poverty Under the Age of 5 Correlation Summary
| Measurement | Inupiat | Immigrants from France |
| Minimum | 5.8% | 7.1% |
| Maximum | 81.2% | 100.0% |
| Range | 75.5% | 92.9% |
| Mean | 32.0% | 25.4% |
| Median | 23.5% | 14.0% |
| Interquartile 25% (IQ1) | 17.4% | 12.1% |
| Interquartile 75% (IQ3) | 46.3% | 31.0% |
| Interquartile Range (IQR) | 28.8% | 18.9% |
| Standard Deviation (Sample) | 18.5% | 25.1% |
| Standard Deviation (Population) | 18.3% | 24.3% |
Similar Demographics by Child Poverty Under the Age of 5
Demographics Similar to Inupiat by Child Poverty Under the Age of 5
In terms of child poverty under the age of 5, the demographic groups most similar to Inupiat are Iroquois (22.0%, a difference of 0.090%), Immigrants from Guatemala (22.0%, a difference of 0.11%), Immigrants from Central America (22.0%, a difference of 0.25%), Alaskan Athabascan (21.8%, a difference of 0.91%), and Chickasaw (21.8%, a difference of 0.92%).
| Demographics | Rating | Rank | Child Poverty Under the Age of 5 |
| Yaqui | 0.0 /100 | #296 | Tragic 21.7% |
| Hispanics or Latinos | 0.0 /100 | #297 | Tragic 21.7% |
| Blackfeet | 0.0 /100 | #298 | Tragic 21.8% |
| Chickasaw | 0.0 /100 | #299 | Tragic 21.8% |
| Alaskan Athabascans | 0.0 /100 | #300 | Tragic 21.8% |
| Immigrants | Central America | 0.0 /100 | #301 | Tragic 22.0% |
| Iroquois | 0.0 /100 | #302 | Tragic 22.0% |
| Inupiat | 0.0 /100 | #303 | Tragic 22.0% |
| Immigrants | Guatemala | 0.0 /100 | #304 | Tragic 22.0% |
| Immigrants | Mexico | 0.0 /100 | #305 | Tragic 22.2% |
| Indonesians | 0.0 /100 | #306 | Tragic 22.3% |
| Immigrants | Bahamas | 0.0 /100 | #307 | Tragic 22.7% |
| Immigrants | Dominica | 0.0 /100 | #308 | Tragic 22.7% |
| Houma | 0.0 /100 | #309 | Tragic 22.7% |
| Africans | 0.0 /100 | #310 | Tragic 22.8% |
Demographics Similar to Immigrants from France by Child Poverty Under the Age of 5
In terms of child poverty under the age of 5, the demographic groups most similar to Immigrants from France are Immigrants from Croatia (15.6%, a difference of 0.0%), Jordanian (15.6%, a difference of 0.060%), Polish (15.7%, a difference of 0.11%), Immigrants from Vietnam (15.6%, a difference of 0.12%), and Scandinavian (15.7%, a difference of 0.17%).
| Demographics | Rating | Rank | Child Poverty Under the Age of 5 |
| Chileans | 97.6 /100 | #83 | Exceptional 15.6% |
| Immigrants | Netherlands | 97.6 /100 | #84 | Exceptional 15.6% |
| Immigrants | Latvia | 97.4 /100 | #85 | Exceptional 15.6% |
| Immigrants | Malaysia | 97.4 /100 | #86 | Exceptional 15.6% |
| Immigrants | Vietnam | 97.4 /100 | #87 | Exceptional 15.6% |
| Jordanians | 97.3 /100 | #88 | Exceptional 15.6% |
| Immigrants | Croatia | 97.3 /100 | #89 | Exceptional 15.6% |
| Immigrants | France | 97.3 /100 | #90 | Exceptional 15.6% |
| Poles | 97.2 /100 | #91 | Exceptional 15.7% |
| Scandinavians | 97.1 /100 | #92 | Exceptional 15.7% |
| Ukrainians | 97.1 /100 | #93 | Exceptional 15.7% |
| Immigrants | South Eastern Asia | 97.1 /100 | #94 | Exceptional 15.7% |
| Immigrants | Switzerland | 96.4 /100 | #95 | Exceptional 15.8% |
| Immigrants | Kazakhstan | 96.2 /100 | #96 | Exceptional 15.8% |
| Macedonians | 96.2 /100 | #97 | Exceptional 15.8% |