Inupiat vs Iranian No Schooling Completed
COMPARE
Inupiat
Iranian
No Schooling Completed
No Schooling Completed Comparison
Inupiat
Iranians
1.5%
NO SCHOOLING COMPLETED
100.0/ 100
METRIC RATING
31st/ 347
METRIC RANK
1.8%
NO SCHOOLING COMPLETED
98.2/ 100
METRIC RATING
98th/ 347
METRIC RANK
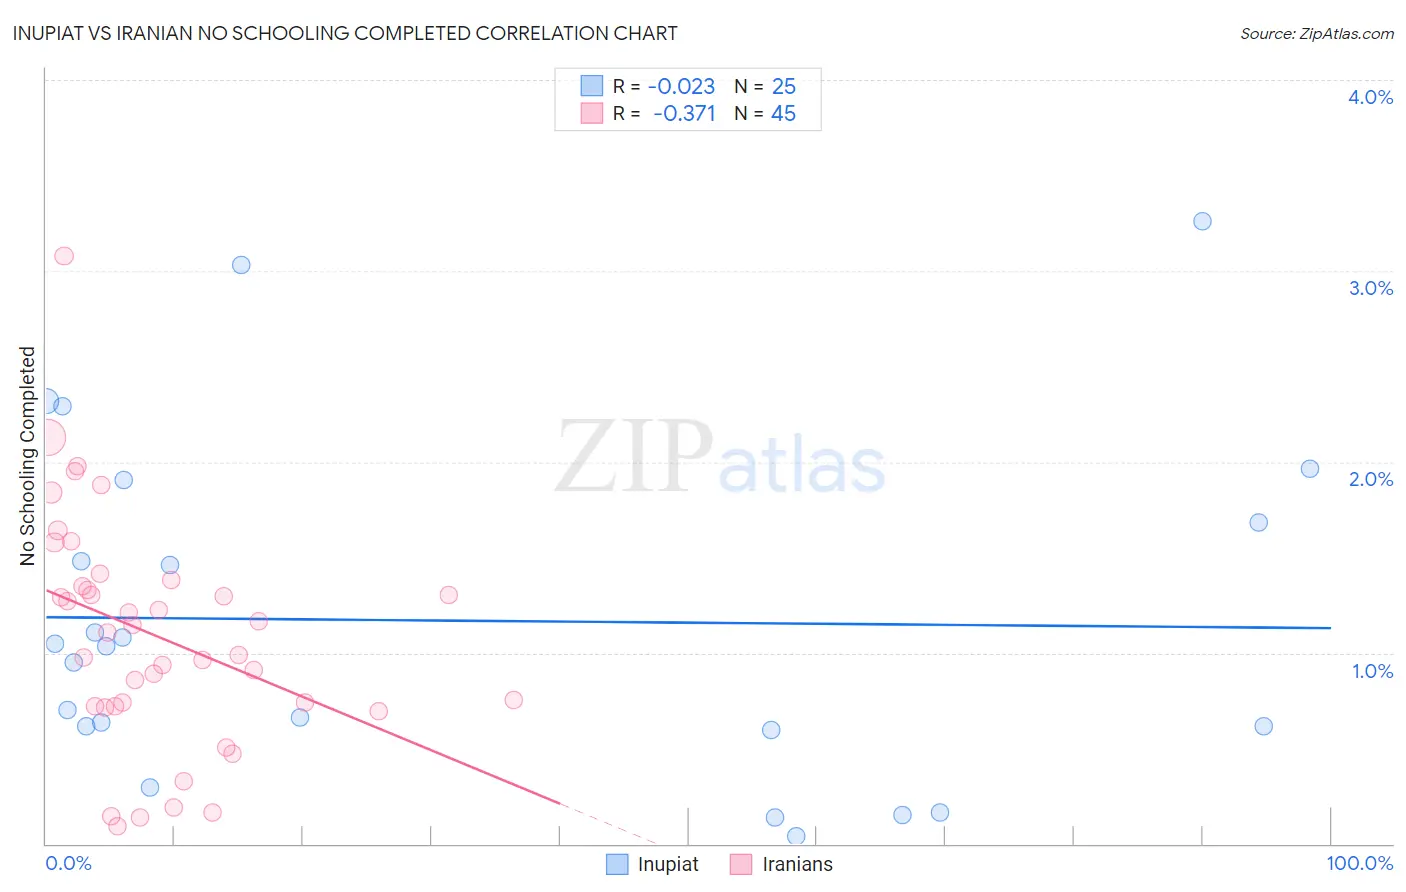
Inupiat vs Iranian No Schooling Completed Correlation Chart
The statistical analysis conducted on geographies consisting of 95,835,764 people shows no correlation between the proportion of Inupiat and percentage of population with no schooling in the United States with a correlation coefficient (R) of -0.023 and weighted average of 1.5%. Similarly, the statistical analysis conducted on geographies consisting of 314,406,519 people shows a mild negative correlation between the proportion of Iranians and percentage of population with no schooling in the United States with a correlation coefficient (R) of -0.371 and weighted average of 1.8%, a difference of 18.9%.
No Schooling Completed Correlation Summary
| Measurement | Inupiat | Iranian |
| Minimum | 0.041% | 0.093% |
| Maximum | 3.3% | 3.1% |
| Range | 3.2% | 3.0% |
| Mean | 1.2% | 1.1% |
| Median | 1.0% | 1.1% |
| Interquartile 25% (IQ1) | 0.60% | 0.72% |
| Interquartile 75% (IQ3) | 1.8% | 1.4% |
| Interquartile Range (IQR) | 1.2% | 0.65% |
| Standard Deviation (Sample) | 0.89% | 0.60% |
| Standard Deviation (Population) | 0.87% | 0.60% |
Similar Demographics by No Schooling Completed
Demographics Similar to Inupiat by No Schooling Completed
In terms of no schooling completed, the demographic groups most similar to Inupiat are British (1.5%, a difference of 0.030%), Swiss (1.5%, a difference of 0.39%), Lumbee (1.5%, a difference of 0.51%), Italian (1.5%, a difference of 1.1%), and Latvian (1.5%, a difference of 1.3%).
| Demographics | Rating | Rank | No Schooling Completed |
| Pennsylvania Germans | 100.0 /100 | #24 | Exceptional 1.5% |
| French | 100.0 /100 | #25 | Exceptional 1.5% |
| Czechs | 100.0 /100 | #26 | Exceptional 1.5% |
| Scandinavians | 100.0 /100 | #27 | Exceptional 1.5% |
| French Canadians | 100.0 /100 | #28 | Exceptional 1.5% |
| Lumbee | 100.0 /100 | #29 | Exceptional 1.5% |
| British | 100.0 /100 | #30 | Exceptional 1.5% |
| Inupiat | 100.0 /100 | #31 | Exceptional 1.5% |
| Swiss | 100.0 /100 | #32 | Exceptional 1.5% |
| Italians | 100.0 /100 | #33 | Exceptional 1.5% |
| Latvians | 100.0 /100 | #34 | Exceptional 1.5% |
| Eastern Europeans | 100.0 /100 | #35 | Exceptional 1.6% |
| Aleuts | 99.9 /100 | #36 | Exceptional 1.6% |
| Belgians | 99.9 /100 | #37 | Exceptional 1.6% |
| Northern Europeans | 99.9 /100 | #38 | Exceptional 1.6% |
Demographics Similar to Iranians by No Schooling Completed
In terms of no schooling completed, the demographic groups most similar to Iranians are Choctaw (1.8%, a difference of 0.19%), Immigrants from Ireland (1.8%, a difference of 0.28%), Immigrants from Singapore (1.8%, a difference of 0.39%), Bhutanese (1.8%, a difference of 0.46%), and Immigrants from Czechoslovakia (1.8%, a difference of 0.68%).
| Demographics | Rating | Rank | No Schooling Completed |
| Immigrants | Germany | 99.0 /100 | #91 | Exceptional 1.8% |
| Romanians | 98.8 /100 | #92 | Exceptional 1.8% |
| Turks | 98.7 /100 | #93 | Exceptional 1.8% |
| Immigrants | Nonimmigrants | 98.5 /100 | #94 | Exceptional 1.8% |
| Puget Sound Salish | 98.5 /100 | #95 | Exceptional 1.8% |
| Bhutanese | 98.4 /100 | #96 | Exceptional 1.8% |
| Immigrants | Ireland | 98.4 /100 | #97 | Exceptional 1.8% |
| Iranians | 98.2 /100 | #98 | Exceptional 1.8% |
| Choctaw | 98.1 /100 | #99 | Exceptional 1.8% |
| Immigrants | Singapore | 98.0 /100 | #100 | Exceptional 1.8% |
| Immigrants | Czechoslovakia | 97.9 /100 | #101 | Exceptional 1.8% |
| Immigrants | Switzerland | 97.9 /100 | #102 | Exceptional 1.8% |
| Basques | 97.9 /100 | #103 | Exceptional 1.8% |
| Thais | 97.5 /100 | #104 | Exceptional 1.8% |
| German Russians | 97.5 /100 | #105 | Exceptional 1.8% |