Inupiat vs British No Schooling Completed
COMPARE
Inupiat
British
No Schooling Completed
No Schooling Completed Comparison
Inupiat
British
1.5%
NO SCHOOLING COMPLETED
100.0/ 100
METRIC RATING
31st/ 347
METRIC RANK
1.5%
NO SCHOOLING COMPLETED
100.0/ 100
METRIC RATING
30th/ 347
METRIC RANK
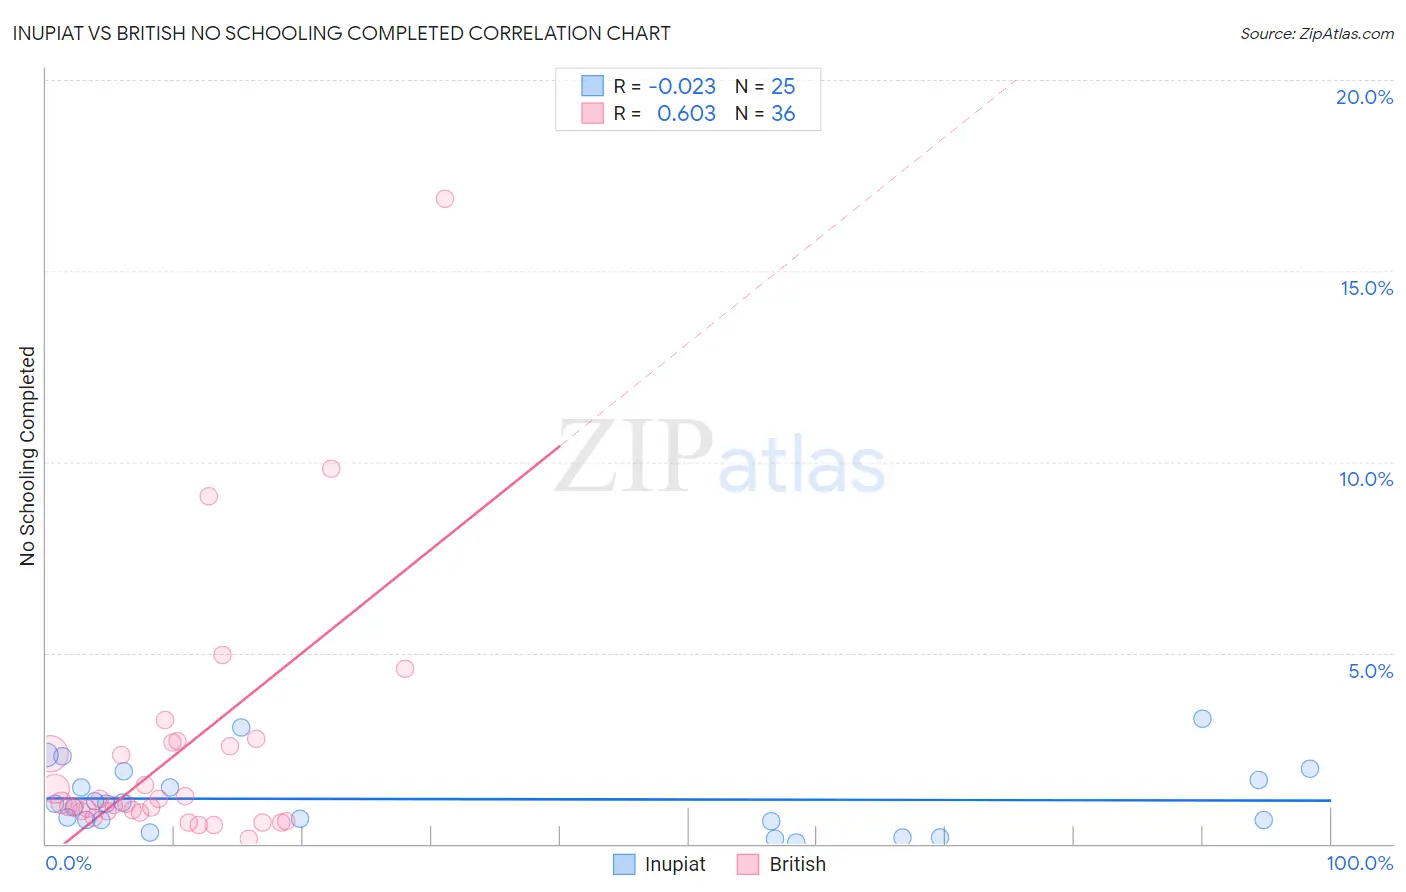
Inupiat vs British No Schooling Completed Correlation Chart
The statistical analysis conducted on geographies consisting of 95,835,764 people shows no correlation between the proportion of Inupiat and percentage of population with no schooling in the United States with a correlation coefficient (R) of -0.023 and weighted average of 1.5%. Similarly, the statistical analysis conducted on geographies consisting of 518,649,413 people shows a significant positive correlation between the proportion of British and percentage of population with no schooling in the United States with a correlation coefficient (R) of 0.603 and weighted average of 1.5%, a difference of 0.030%.
No Schooling Completed Correlation Summary
| Measurement | Inupiat | British |
| Minimum | 0.041% | 0.14% |
| Maximum | 3.3% | 16.9% |
| Range | 3.2% | 16.8% |
| Mean | 1.2% | 2.4% |
| Median | 1.0% | 1.1% |
| Interquartile 25% (IQ1) | 0.60% | 0.83% |
| Interquartile 75% (IQ3) | 1.8% | 2.6% |
| Interquartile Range (IQR) | 1.2% | 1.8% |
| Standard Deviation (Sample) | 0.89% | 3.3% |
| Standard Deviation (Population) | 0.87% | 3.3% |
Demographics Similar to Inupiat and British by No Schooling Completed
In terms of no schooling completed, the demographic groups most similar to Inupiat are Swiss (1.5%, a difference of 0.39%), Lumbee (1.5%, a difference of 0.51%), Italian (1.5%, a difference of 1.1%), Latvian (1.5%, a difference of 1.3%), and French Canadian (1.5%, a difference of 1.4%). Similarly, the demographic groups most similar to British are Swiss (1.5%, a difference of 0.42%), Lumbee (1.5%, a difference of 0.48%), Italian (1.5%, a difference of 1.1%), Latvian (1.5%, a difference of 1.4%), and French Canadian (1.5%, a difference of 1.4%).
| Demographics | Rating | Rank | No Schooling Completed |
| Welsh | 100.0 /100 | #20 | Exceptional 1.5% |
| Chinese | 100.0 /100 | #21 | Exceptional 1.5% |
| Alaska Natives | 100.0 /100 | #22 | Exceptional 1.5% |
| Europeans | 100.0 /100 | #23 | Exceptional 1.5% |
| Pennsylvania Germans | 100.0 /100 | #24 | Exceptional 1.5% |
| French | 100.0 /100 | #25 | Exceptional 1.5% |
| Czechs | 100.0 /100 | #26 | Exceptional 1.5% |
| Scandinavians | 100.0 /100 | #27 | Exceptional 1.5% |
| French Canadians | 100.0 /100 | #28 | Exceptional 1.5% |
| Lumbee | 100.0 /100 | #29 | Exceptional 1.5% |
| British | 100.0 /100 | #30 | Exceptional 1.5% |
| Inupiat | 100.0 /100 | #31 | Exceptional 1.5% |
| Swiss | 100.0 /100 | #32 | Exceptional 1.5% |
| Italians | 100.0 /100 | #33 | Exceptional 1.5% |
| Latvians | 100.0 /100 | #34 | Exceptional 1.5% |
| Eastern Europeans | 100.0 /100 | #35 | Exceptional 1.6% |
| Aleuts | 99.9 /100 | #36 | Exceptional 1.6% |
| Belgians | 99.9 /100 | #37 | Exceptional 1.6% |
| Northern Europeans | 99.9 /100 | #38 | Exceptional 1.6% |
| Native Hawaiians | 99.9 /100 | #39 | Exceptional 1.6% |
| Luxembourgers | 99.9 /100 | #40 | Exceptional 1.6% |