Inupiat vs Immigrants from France 5th Grade
COMPARE
Inupiat
Immigrants from France
5th Grade
5th Grade Comparison
Inupiat
Immigrants from France
98.4%
5TH GRADE
100.0/ 100
METRIC RATING
7th/ 347
METRIC RANK
97.6%
5TH GRADE
94.8/ 100
METRIC RATING
121st/ 347
METRIC RANK
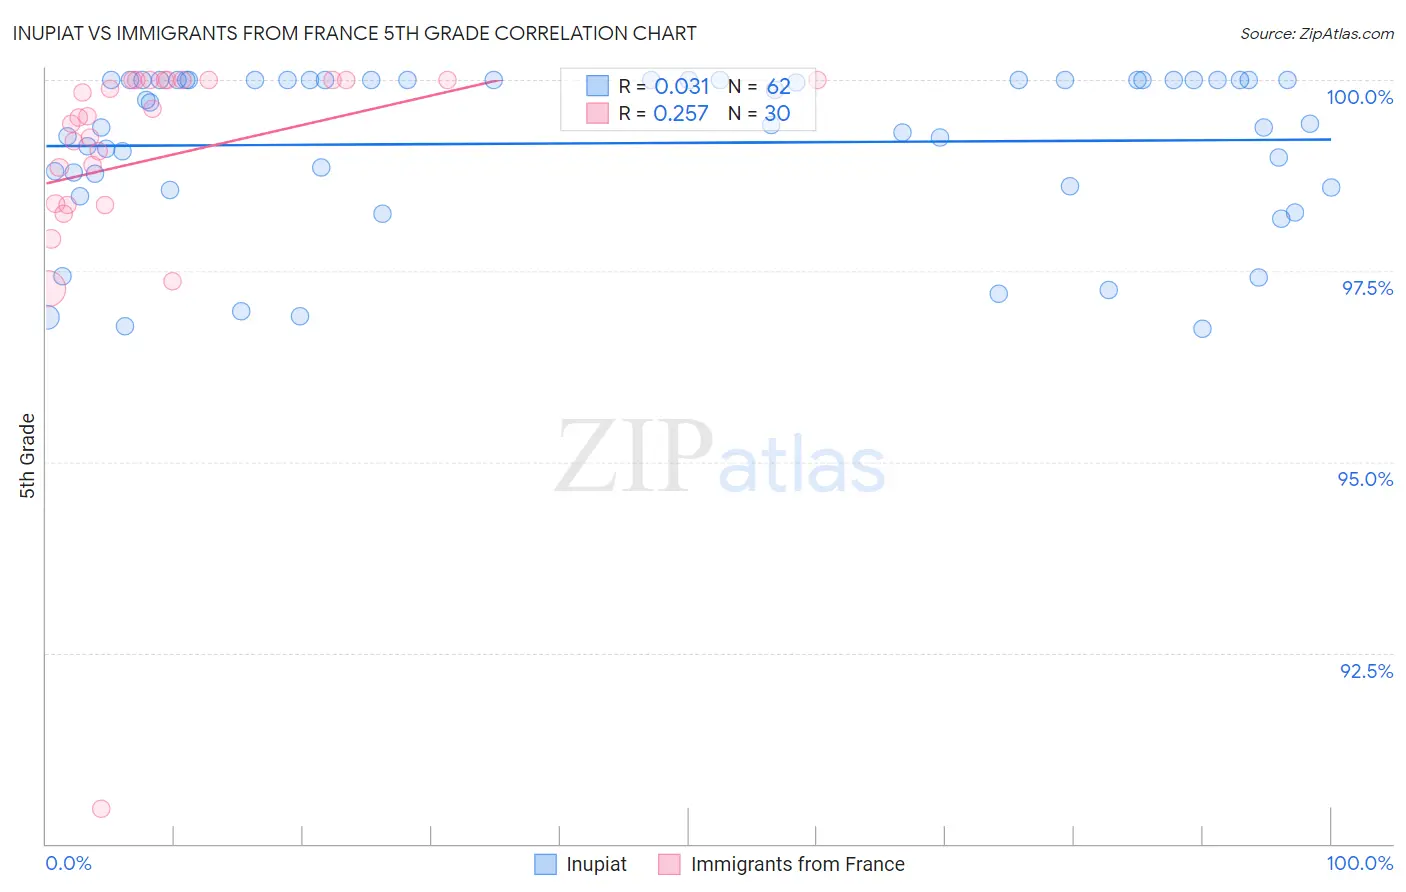
Inupiat vs Immigrants from France 5th Grade Correlation Chart
The statistical analysis conducted on geographies consisting of 96,348,974 people shows no correlation between the proportion of Inupiat and percentage of population with at least 5th grade education in the United States with a correlation coefficient (R) of 0.031 and weighted average of 98.4%. Similarly, the statistical analysis conducted on geographies consisting of 287,920,814 people shows a weak positive correlation between the proportion of Immigrants from France and percentage of population with at least 5th grade education in the United States with a correlation coefficient (R) of 0.257 and weighted average of 97.6%, a difference of 0.76%.
5th Grade Correlation Summary
| Measurement | Inupiat | Immigrants from France |
| Minimum | 96.7% | 90.5% |
| Maximum | 100.0% | 100.0% |
| Range | 3.3% | 9.5% |
| Mean | 99.2% | 99.0% |
| Median | 99.6% | 99.5% |
| Interquartile 25% (IQ1) | 98.6% | 98.4% |
| Interquartile 75% (IQ3) | 100.0% | 100.0% |
| Interquartile Range (IQR) | 1.4% | 1.6% |
| Standard Deviation (Sample) | 1.0% | 1.8% |
| Standard Deviation (Population) | 1.0% | 1.8% |
Similar Demographics by 5th Grade
Demographics Similar to Inupiat by 5th Grade
In terms of 5th grade, the demographic groups most similar to Inupiat are Slovene (98.3%, a difference of 0.020%), Slovak (98.4%, a difference of 0.030%), German (98.4%, a difference of 0.030%), Norwegian (98.4%, a difference of 0.050%), and Tsimshian (98.4%, a difference of 0.050%).
| Demographics | Rating | Rank | 5th Grade |
| Crow | 100.0 /100 | #1 | Exceptional 99.5% |
| Welsh | 100.0 /100 | #2 | Exceptional 98.6% |
| Norwegians | 100.0 /100 | #3 | Exceptional 98.4% |
| Tsimshian | 100.0 /100 | #4 | Exceptional 98.4% |
| Slovaks | 100.0 /100 | #5 | Exceptional 98.4% |
| Germans | 100.0 /100 | #6 | Exceptional 98.4% |
| Inupiat | 100.0 /100 | #7 | Exceptional 98.4% |
| Slovenes | 100.0 /100 | #8 | Exceptional 98.3% |
| Swedes | 100.0 /100 | #9 | Exceptional 98.3% |
| English | 100.0 /100 | #10 | Exceptional 98.3% |
| Alaskan Athabascans | 100.0 /100 | #11 | Exceptional 98.3% |
| Carpatho Rusyns | 100.0 /100 | #12 | Exceptional 98.3% |
| Tlingit-Haida | 100.0 /100 | #13 | Exceptional 98.3% |
| Dutch | 100.0 /100 | #14 | Exceptional 98.3% |
| Scottish | 100.0 /100 | #15 | Exceptional 98.3% |
Demographics Similar to Immigrants from France by 5th Grade
In terms of 5th grade, the demographic groups most similar to Immigrants from France are Immigrants from Zimbabwe (97.6%, a difference of 0.0%), Immigrants from Japan (97.6%, a difference of 0.0%), Immigrants from Norway (97.6%, a difference of 0.0%), Immigrants from Saudi Arabia (97.6%, a difference of 0.010%), and Basque (97.6%, a difference of 0.010%).
| Demographics | Rating | Rank | 5th Grade |
| Lebanese | 95.7 /100 | #114 | Exceptional 97.6% |
| Okinawans | 95.7 /100 | #115 | Exceptional 97.6% |
| Immigrants | Croatia | 95.5 /100 | #116 | Exceptional 97.6% |
| Immigrants | Saudi Arabia | 95.4 /100 | #117 | Exceptional 97.6% |
| Basques | 95.2 /100 | #118 | Exceptional 97.6% |
| Syrians | 95.1 /100 | #119 | Exceptional 97.6% |
| Immigrants | Zimbabwe | 94.9 /100 | #120 | Exceptional 97.6% |
| Immigrants | France | 94.8 /100 | #121 | Exceptional 97.6% |
| Immigrants | Japan | 94.7 /100 | #122 | Exceptional 97.6% |
| Immigrants | Norway | 94.6 /100 | #123 | Exceptional 97.6% |
| Spanish | 93.7 /100 | #124 | Exceptional 97.6% |
| Immigrants | Bulgaria | 93.1 /100 | #125 | Exceptional 97.6% |
| Hmong | 92.3 /100 | #126 | Exceptional 97.6% |
| Immigrants | Serbia | 92.3 /100 | #127 | Exceptional 97.6% |
| Colville | 92.0 /100 | #128 | Exceptional 97.6% |