Inupiat vs Assyrian/Chaldean/Syriac No Schooling Completed
COMPARE
Inupiat
Assyrian/Chaldean/Syriac
No Schooling Completed
No Schooling Completed Comparison
Inupiat
Assyrians/Chaldeans/Syriacs
1.5%
NO SCHOOLING COMPLETED
100.0/ 100
METRIC RATING
31st/ 347
METRIC RANK
2.5%
NO SCHOOLING COMPLETED
0.6/ 100
METRIC RATING
258th/ 347
METRIC RANK
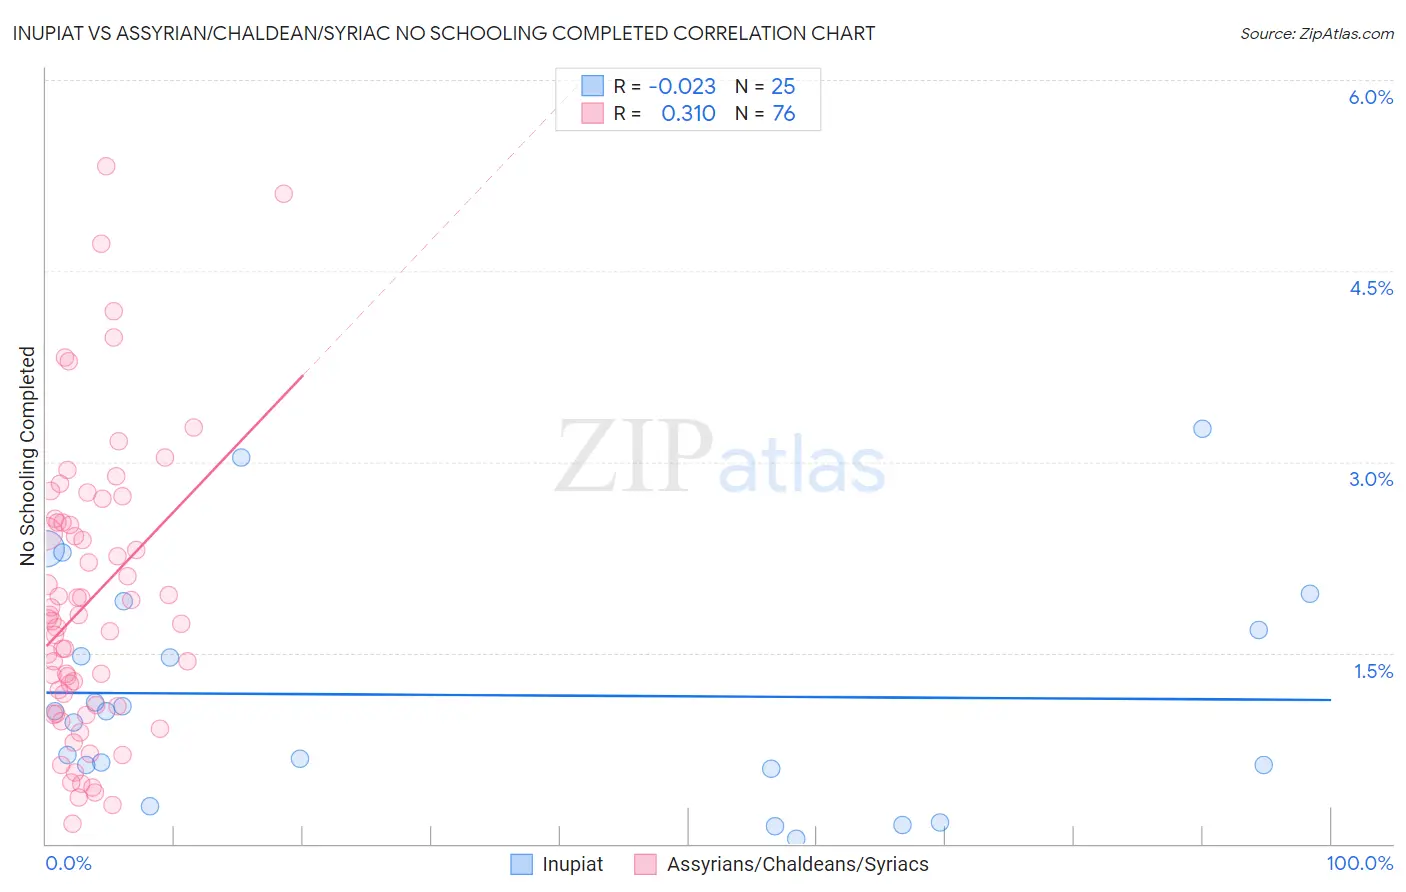
Inupiat vs Assyrian/Chaldean/Syriac No Schooling Completed Correlation Chart
The statistical analysis conducted on geographies consisting of 95,835,764 people shows no correlation between the proportion of Inupiat and percentage of population with no schooling in the United States with a correlation coefficient (R) of -0.023 and weighted average of 1.5%. Similarly, the statistical analysis conducted on geographies consisting of 110,066,308 people shows a mild positive correlation between the proportion of Assyrians/Chaldeans/Syriacs and percentage of population with no schooling in the United States with a correlation coefficient (R) of 0.310 and weighted average of 2.5%, a difference of 61.2%.
No Schooling Completed Correlation Summary
| Measurement | Inupiat | Assyrian/Chaldean/Syriac |
| Minimum | 0.041% | 0.15% |
| Maximum | 3.3% | 5.3% |
| Range | 3.2% | 5.2% |
| Mean | 1.2% | 1.9% |
| Median | 1.0% | 1.8% |
| Interquartile 25% (IQ1) | 0.60% | 1.1% |
| Interquartile 75% (IQ3) | 1.8% | 2.5% |
| Interquartile Range (IQR) | 1.2% | 1.4% |
| Standard Deviation (Sample) | 0.89% | 1.1% |
| Standard Deviation (Population) | 0.87% | 1.1% |
Similar Demographics by No Schooling Completed
Demographics Similar to Inupiat by No Schooling Completed
In terms of no schooling completed, the demographic groups most similar to Inupiat are British (1.5%, a difference of 0.030%), Swiss (1.5%, a difference of 0.39%), Lumbee (1.5%, a difference of 0.51%), Italian (1.5%, a difference of 1.1%), and Latvian (1.5%, a difference of 1.3%).
| Demographics | Rating | Rank | No Schooling Completed |
| Pennsylvania Germans | 100.0 /100 | #24 | Exceptional 1.5% |
| French | 100.0 /100 | #25 | Exceptional 1.5% |
| Czechs | 100.0 /100 | #26 | Exceptional 1.5% |
| Scandinavians | 100.0 /100 | #27 | Exceptional 1.5% |
| French Canadians | 100.0 /100 | #28 | Exceptional 1.5% |
| Lumbee | 100.0 /100 | #29 | Exceptional 1.5% |
| British | 100.0 /100 | #30 | Exceptional 1.5% |
| Inupiat | 100.0 /100 | #31 | Exceptional 1.5% |
| Swiss | 100.0 /100 | #32 | Exceptional 1.5% |
| Italians | 100.0 /100 | #33 | Exceptional 1.5% |
| Latvians | 100.0 /100 | #34 | Exceptional 1.5% |
| Eastern Europeans | 100.0 /100 | #35 | Exceptional 1.6% |
| Aleuts | 99.9 /100 | #36 | Exceptional 1.6% |
| Belgians | 99.9 /100 | #37 | Exceptional 1.6% |
| Northern Europeans | 99.9 /100 | #38 | Exceptional 1.6% |
Demographics Similar to Assyrians/Chaldeans/Syriacs by No Schooling Completed
In terms of no schooling completed, the demographic groups most similar to Assyrians/Chaldeans/Syriacs are Immigrants from South America (2.5%, a difference of 0.030%), Immigrants from Jamaica (2.5%, a difference of 0.060%), Immigrants from Ethiopia (2.5%, a difference of 0.11%), Armenian (2.5%, a difference of 0.23%), and Immigrants from Sierra Leone (2.5%, a difference of 0.58%).
| Demographics | Rating | Rank | No Schooling Completed |
| Immigrants | Africa | 1.1 /100 | #251 | Tragic 2.4% |
| Immigrants | Colombia | 1.0 /100 | #252 | Tragic 2.4% |
| Immigrants | Asia | 0.9 /100 | #253 | Tragic 2.4% |
| Immigrants | Eastern Africa | 0.9 /100 | #254 | Tragic 2.4% |
| Ethiopians | 0.8 /100 | #255 | Tragic 2.4% |
| Yaqui | 0.8 /100 | #256 | Tragic 2.4% |
| Immigrants | South America | 0.6 /100 | #257 | Tragic 2.5% |
| Assyrians/Chaldeans/Syriacs | 0.6 /100 | #258 | Tragic 2.5% |
| Immigrants | Jamaica | 0.6 /100 | #259 | Tragic 2.5% |
| Immigrants | Ethiopia | 0.6 /100 | #260 | Tragic 2.5% |
| Armenians | 0.5 /100 | #261 | Tragic 2.5% |
| Immigrants | Sierra Leone | 0.5 /100 | #262 | Tragic 2.5% |
| Immigrants | Liberia | 0.4 /100 | #263 | Tragic 2.5% |
| Indians (Asian) | 0.4 /100 | #264 | Tragic 2.5% |
| West Indians | 0.4 /100 | #265 | Tragic 2.5% |