Indonesian vs Polish Professional Degree
COMPARE
Indonesian
Polish
Professional Degree
Professional Degree Comparison
Indonesians
Poles
3.7%
PROFESSIONAL DEGREE
1.0/ 100
METRIC RATING
260th/ 347
METRIC RANK
4.6%
PROFESSIONAL DEGREE
72.6/ 100
METRIC RATING
151st/ 347
METRIC RANK
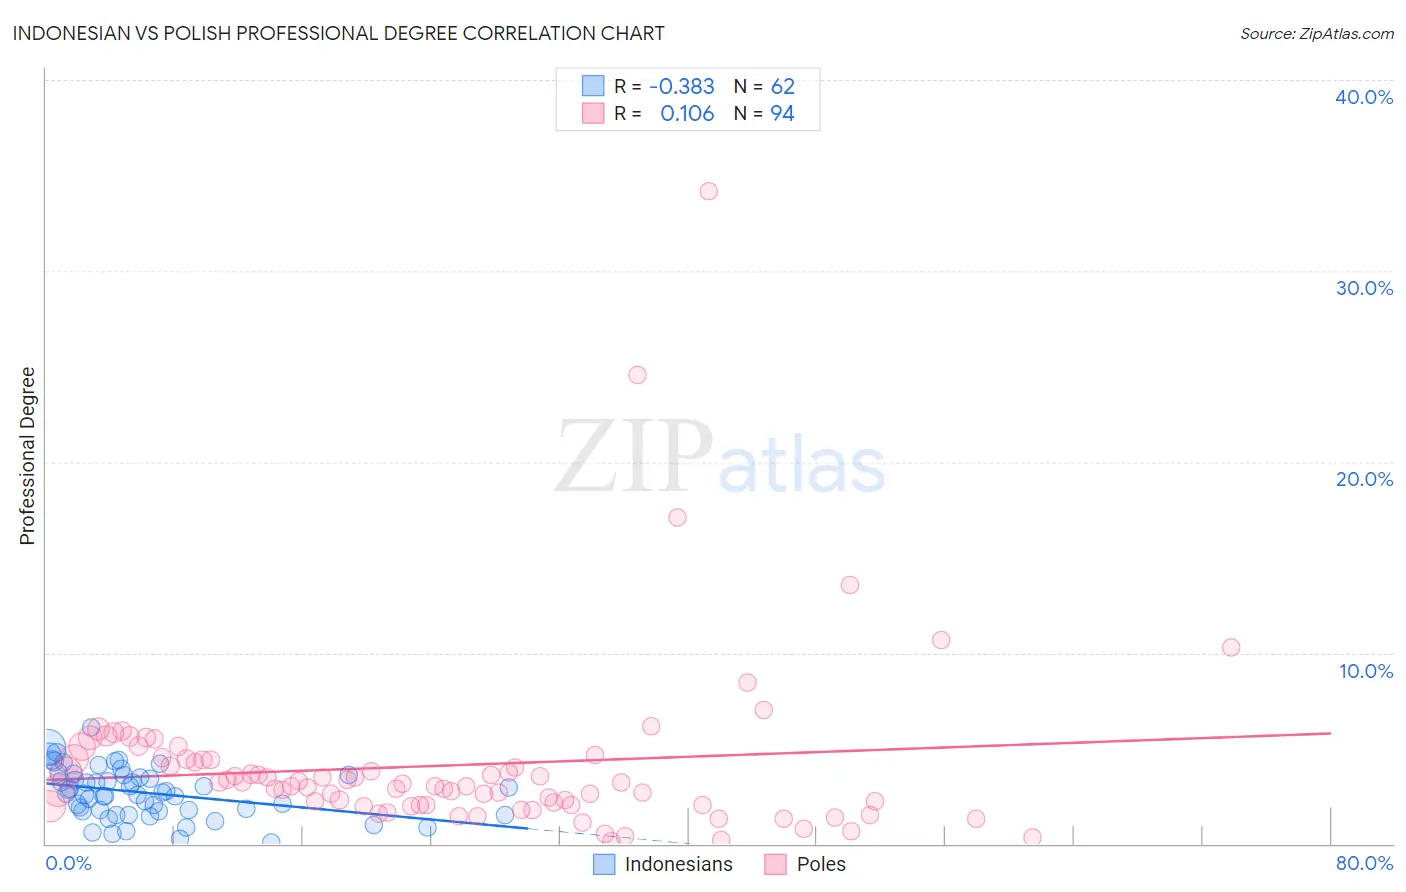
Indonesian vs Polish Professional Degree Correlation Chart
The statistical analysis conducted on geographies consisting of 162,566,642 people shows a mild negative correlation between the proportion of Indonesians and percentage of population with at least professional degree education in the United States with a correlation coefficient (R) of -0.383 and weighted average of 3.7%. Similarly, the statistical analysis conducted on geographies consisting of 553,734,682 people shows a poor positive correlation between the proportion of Poles and percentage of population with at least professional degree education in the United States with a correlation coefficient (R) of 0.106 and weighted average of 4.6%, a difference of 24.3%.
Professional Degree Correlation Summary
| Measurement | Indonesian | Polish |
| Minimum | 0.034% | 0.12% |
| Maximum | 6.1% | 34.2% |
| Range | 6.0% | 34.0% |
| Mean | 2.7% | 4.1% |
| Median | 2.6% | 3.1% |
| Interquartile 25% (IQ1) | 1.7% | 2.0% |
| Interquartile 75% (IQ3) | 3.6% | 4.4% |
| Interquartile Range (IQR) | 1.8% | 2.4% |
| Standard Deviation (Sample) | 1.3% | 4.6% |
| Standard Deviation (Population) | 1.3% | 4.6% |
Similar Demographics by Professional Degree
Demographics Similar to Indonesians by Professional Degree
In terms of professional degree, the demographic groups most similar to Indonesians are African (3.7%, a difference of 0.010%), Immigrants from Guyana (3.7%, a difference of 0.18%), U.S. Virgin Islander (3.7%, a difference of 0.19%), Immigrants from St. Vincent and the Grenadines (3.7%, a difference of 0.23%), and Bahamian (3.7%, a difference of 0.31%).
| Demographics | Rating | Rank | Professional Degree |
| Pueblo | 1.4 /100 | #253 | Tragic 3.7% |
| Tongans | 1.3 /100 | #254 | Tragic 3.7% |
| Osage | 1.2 /100 | #255 | Tragic 3.7% |
| Iroquois | 1.2 /100 | #256 | Tragic 3.7% |
| Bahamians | 1.1 /100 | #257 | Tragic 3.7% |
| Immigrants | St. Vincent and the Grenadines | 1.1 /100 | #258 | Tragic 3.7% |
| Africans | 1.0 /100 | #259 | Tragic 3.7% |
| Indonesians | 1.0 /100 | #260 | Tragic 3.7% |
| Immigrants | Guyana | 1.0 /100 | #261 | Tragic 3.7% |
| U.S. Virgin Islanders | 1.0 /100 | #262 | Tragic 3.7% |
| Hopi | 0.9 /100 | #263 | Tragic 3.6% |
| Immigrants | Cambodia | 0.9 /100 | #264 | Tragic 3.6% |
| Immigrants | Congo | 0.8 /100 | #265 | Tragic 3.6% |
| Central American Indians | 0.8 /100 | #266 | Tragic 3.6% |
| Delaware | 0.7 /100 | #267 | Tragic 3.6% |
Demographics Similar to Poles by Professional Degree
In terms of professional degree, the demographic groups most similar to Poles are Immigrants from Africa (4.6%, a difference of 0.010%), Immigrants from Uruguay (4.6%, a difference of 0.020%), Immigrants from Oceania (4.6%, a difference of 0.14%), Scottish (4.6%, a difference of 0.14%), and Slavic (4.5%, a difference of 0.31%).
| Demographics | Rating | Rank | Professional Degree |
| Immigrants | South America | 80.5 /100 | #144 | Excellent 4.6% |
| Uruguayans | 80.2 /100 | #145 | Excellent 4.6% |
| Luxembourgers | 78.7 /100 | #146 | Good 4.6% |
| Colombians | 77.7 /100 | #147 | Good 4.6% |
| Slovenes | 76.1 /100 | #148 | Good 4.6% |
| Senegalese | 75.3 /100 | #149 | Good 4.6% |
| Immigrants | Oceania | 73.4 /100 | #150 | Good 4.6% |
| Poles | 72.6 /100 | #151 | Good 4.6% |
| Immigrants | Africa | 72.5 /100 | #152 | Good 4.6% |
| Immigrants | Uruguay | 72.5 /100 | #153 | Good 4.6% |
| Scottish | 71.8 /100 | #154 | Good 4.6% |
| Slavs | 70.8 /100 | #155 | Good 4.5% |
| Swedes | 69.9 /100 | #156 | Good 4.5% |
| Iraqis | 69.8 /100 | #157 | Good 4.5% |
| Immigrants | Armenia | 68.8 /100 | #158 | Good 4.5% |