Indonesian vs Comanche Professional Degree
COMPARE
Indonesian
Comanche
Professional Degree
Professional Degree Comparison
Indonesians
Comanche
3.7%
PROFESSIONAL DEGREE
1.0/ 100
METRIC RATING
260th/ 347
METRIC RANK
3.5%
PROFESSIONAL DEGREE
0.4/ 100
METRIC RATING
283rd/ 347
METRIC RANK
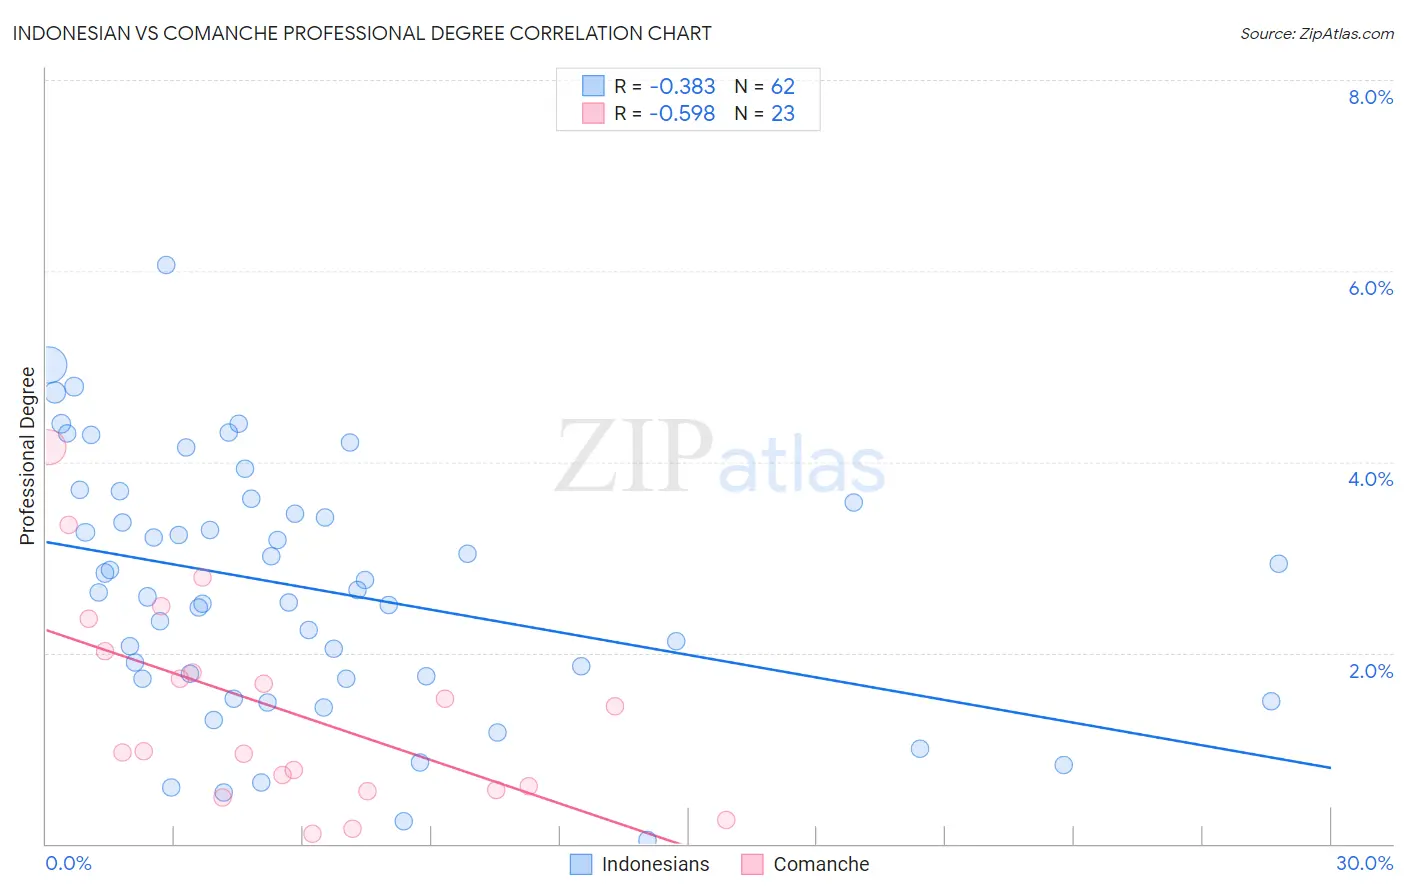
Indonesian vs Comanche Professional Degree Correlation Chart
The statistical analysis conducted on geographies consisting of 162,566,642 people shows a mild negative correlation between the proportion of Indonesians and percentage of population with at least professional degree education in the United States with a correlation coefficient (R) of -0.383 and weighted average of 3.7%. Similarly, the statistical analysis conducted on geographies consisting of 109,559,847 people shows a substantial negative correlation between the proportion of Comanche and percentage of population with at least professional degree education in the United States with a correlation coefficient (R) of -0.598 and weighted average of 3.5%, a difference of 3.9%.
Professional Degree Correlation Summary
| Measurement | Indonesian | Comanche |
| Minimum | 0.034% | 0.11% |
| Maximum | 6.1% | 4.1% |
| Range | 6.0% | 4.0% |
| Mean | 2.7% | 1.4% |
| Median | 2.6% | 0.97% |
| Interquartile 25% (IQ1) | 1.7% | 0.57% |
| Interquartile 75% (IQ3) | 3.6% | 2.0% |
| Interquartile Range (IQR) | 1.8% | 1.4% |
| Standard Deviation (Sample) | 1.3% | 1.1% |
| Standard Deviation (Population) | 1.3% | 1.0% |
Similar Demographics by Professional Degree
Demographics Similar to Indonesians by Professional Degree
In terms of professional degree, the demographic groups most similar to Indonesians are African (3.7%, a difference of 0.010%), Immigrants from Guyana (3.7%, a difference of 0.18%), U.S. Virgin Islander (3.7%, a difference of 0.19%), Immigrants from St. Vincent and the Grenadines (3.7%, a difference of 0.23%), and Bahamian (3.7%, a difference of 0.31%).
| Demographics | Rating | Rank | Professional Degree |
| Pueblo | 1.4 /100 | #253 | Tragic 3.7% |
| Tongans | 1.3 /100 | #254 | Tragic 3.7% |
| Osage | 1.2 /100 | #255 | Tragic 3.7% |
| Iroquois | 1.2 /100 | #256 | Tragic 3.7% |
| Bahamians | 1.1 /100 | #257 | Tragic 3.7% |
| Immigrants | St. Vincent and the Grenadines | 1.1 /100 | #258 | Tragic 3.7% |
| Africans | 1.0 /100 | #259 | Tragic 3.7% |
| Indonesians | 1.0 /100 | #260 | Tragic 3.7% |
| Immigrants | Guyana | 1.0 /100 | #261 | Tragic 3.7% |
| U.S. Virgin Islanders | 1.0 /100 | #262 | Tragic 3.7% |
| Hopi | 0.9 /100 | #263 | Tragic 3.6% |
| Immigrants | Cambodia | 0.9 /100 | #264 | Tragic 3.6% |
| Immigrants | Congo | 0.8 /100 | #265 | Tragic 3.6% |
| Central American Indians | 0.8 /100 | #266 | Tragic 3.6% |
| Delaware | 0.7 /100 | #267 | Tragic 3.6% |
Demographics Similar to Comanche by Professional Degree
In terms of professional degree, the demographic groups most similar to Comanche are Salvadoran (3.5%, a difference of 0.10%), Immigrants from Caribbean (3.5%, a difference of 0.30%), Apache (3.5%, a difference of 0.32%), Dominican (3.5%, a difference of 0.34%), and Immigrants from Portugal (3.5%, a difference of 0.38%).
| Demographics | Rating | Rank | Professional Degree |
| Liberians | 0.5 /100 | #276 | Tragic 3.6% |
| Cheyenne | 0.5 /100 | #277 | Tragic 3.6% |
| Japanese | 0.5 /100 | #278 | Tragic 3.5% |
| Immigrants | Portugal | 0.5 /100 | #279 | Tragic 3.5% |
| Dominicans | 0.5 /100 | #280 | Tragic 3.5% |
| Apache | 0.5 /100 | #281 | Tragic 3.5% |
| Immigrants | Caribbean | 0.5 /100 | #282 | Tragic 3.5% |
| Comanche | 0.4 /100 | #283 | Tragic 3.5% |
| Salvadorans | 0.4 /100 | #284 | Tragic 3.5% |
| Hondurans | 0.3 /100 | #285 | Tragic 3.5% |
| Haitians | 0.3 /100 | #286 | Tragic 3.5% |
| Immigrants | El Salvador | 0.3 /100 | #287 | Tragic 3.5% |
| Blackfeet | 0.3 /100 | #288 | Tragic 3.5% |
| Guatemalans | 0.3 /100 | #289 | Tragic 3.5% |
| Chippewa | 0.3 /100 | #290 | Tragic 3.5% |